Clairton: Fire Incidents, Pennsylvania (PA)
Where are fire incidents reported in Clairton, PA
Something went wrong! Please refresh the page.
|
| |||||||||||||||||||||||||||||||||||||||||||||||||||||||||||||||||||||||||||||||||||||||||||||||||||||||||||||
2004 - 2018 National Fire Incident Reporting System (NFIRS) incidents
- Incident types reported to NFIRS in Clairton, PA
- 50728.5%Fire
- 46726.2%Rescue & EMS
- 30917.3%Hazardous Condition
- 20111.3%False Alarm
- 1498.4%Good Intent Call
- 1247.0%Service Call
- 130.7%Severe Weather
- 70.4%Special Incident
- 40.2%Overpressure Rupture
- Fire incident types reported to NFIRS in Clairton, PA
- 34467.9%Structure Fires
- 10520.7%Other
- 336.5%Outside Fires
- 254.9%Mobile Property/Vehicle Fires
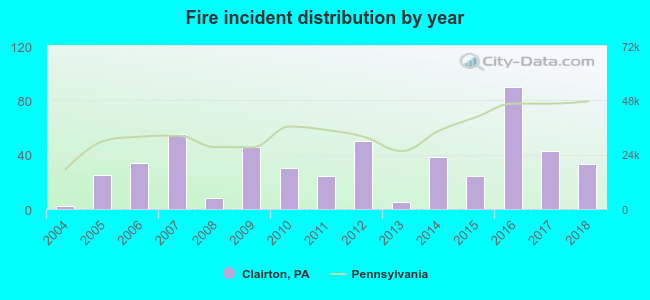 According to the data from the years 2004 - 2018 the average number of fires per year is 34. The highest number of reported fire incidents - 90 took place in 2016, and the least - 2 in 2004. The data has a growing trend.
The average number of yearly fire incidents per 10k residents in Clairton, PA compared to nearest cities:
(Note: Based on data for the last 3 years, including only cities with population 5,000 and above)
| Clairton: | 82.3 |
| Jefferson Hills: | 17.2 |
| McKeesport: | 43.3 |
| Pleasant Hills: | 3.0 |
| West Mifflin: | 48.2 |
| White Oak: | 18.3 |
| Duquesne: | 61.6 |
| Baldwin: | 16.5 |
| Munhall: | 46.6 |
 The median response time based on all reported fire incidents is 6 minutes. This is close to the state median value.
The median response time in Clairton, PA compared to nearest cities:
(Note: Based on data for all years, including only cities with at least 500 fire incidents)
| Clairton: | 6 minutes |
| McKeesport: | 5 minutes |
| West Mifflin: | 7 minutes |
| Irwin: | 5 minutes |
| Monroeville: | 6 minutes |
| Pittsburgh: | 4 minutes |
 32.3% incidents where reported in the morning and 67.7% in the evening. The most fires (18.5%) took place on Sunday, and the least (12.0%) on Tuesday.
 According to the 507 reports from years 2004 - 2018 most fires (12.0%) took place during April, and the least (5.5%) in October.
 Out of all 1,781 cases reported during the years 2004 - 2018, the most belonged to the categories: Fire (28.5%), Rescue & EMS (26.2%), and Hazardous Condition (17.3%).
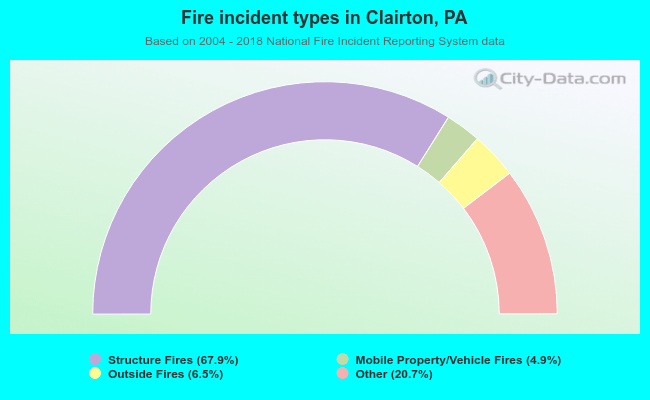 When looking into fire subcategories, the most reports belonged to: Structure Fires (67.9%), and Other (20.7%).