West Hartford: Fire Incidents, Connecticut (CT)
Where are fire incidents reported in West Hartford, CT
Something went wrong! Please refresh the page.
| Fire incidents reported | |
|---|---|
| Sreet name | Count |
| NEW BRITAIN AVE | 258 |
| FARMINGTON AVE | 206 |
| NEW BRITAIN AVENUE | 164 |
| SOUTH MAIN ST | 150 |
| NORTH MAIN ST | 132 |
| KANE ST | 124 |
| ALBANY AVE | 116 |
| BOULEVARD | 104 |
| NEW PARK AVE | 104 |
| FARMINGTON AVENUE | 88 |
| PARK RD | 86 |
| NORTH MAIN STREET | 74 |
| OAKWOOD AVE | 74 |
| PROSPECT AVE | 74 |
| SOUTH MAIN STREET | 72 |
| HILLCREST AVENUE | 58 |
| NEWINGTON RD | 58 |
| STARKEL RD | 56 |
| SOUTH QUAKER LANE | 54 |
| HILLCREST AVE | 44 |
| KANE STREET | 44 |
| OAKWOOD AVENUE | 44 |
| PARK ROAD | 40 |
| FERN ST | 36 |
| SOUTH QUAKER LA | 36 |
| BRIXTON ST | 34 |
| STEVEN STREET | 34 |
| FARMINGTON AVE | 32 |
| ASYLUM AVE | 30 |
| NEW PARK AVENUE | 30 |
| Other | 634 |
2003 - 2018 National Fire Incident Reporting System (NFIRS) incidents
- Incident types reported to NFIRS in West Hartford, CT
- 21,37949.6%Rescue & EMS
- 9,47322.0%Hazardous Condition
- 3,8098.8%False Alarm
- 3,6428.5%Service Call
- 3,0907.2%Fire
- 1,4853.4%Good Intent Call
- 930.2%Overpressure Rupture
- 630.1%Special Incident
- Fire incident types reported to NFIRS in West Hartford, CT
- 1,48548.1%Structure Fires
- 97131.4%Outside Fires
- 43314.0%Mobile Property/Vehicle Fires
- 2016.5%Other
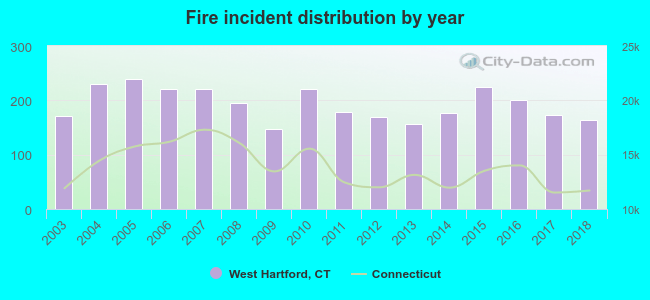 According to the data from the years 2003 - 2018 the average number of fires per year is 193. The highest number of reported fires - 240 took place in 2005, and the least - 147 in 2009. The data has a decreasing trend.
The average number of yearly fire incidents per 10k residents in West Hartford, CT compared to nearest cities:
(Note: Based on data for the last 3 years, including only cities with population 5,000 and above)
| West Hartford: | 28.3 |
| Hartford: | 39.1 |
| Newington: | 31.2 |
| Bloomfield: | 50.8 |
| Wethersfield: | 22.0 |
| Farmington: | 22.1 |
| New Britain: | 45.7 |
| East Hartford: | 37.3 |
| Avon: | 25.6 |
 The median response time based on all reported fire incidents is 4 minutes. This is lower compared to the Connecticut median value.
The median response time in West Hartford, CT compared to nearest cities:
(Note: Based on data for all years, including only cities with at least 500 fire incidents)
| West Hartford: | 4 minutes |
| Hartford: | 4 minutes |
| Newington: | 6 minutes |
| Bloomfield: | 6 minutes |
| Wethersfield: | 7 minutes |
| Farmington: | 7 minutes |
| New Britain: | 4 minutes |
| East Hartford: | 4 minutes |
| Avon: | 7 minutes |
 According to the data from the years 2003 - 2018 the average number of fire-related yearly deaths is 0. The highest number of deaths - 1 took place in 2003, and the lowest - 0 in 2005. The data has a decreasing trend.
The average number of fatalities per 1,000 fire incidents is 2. This indicator was the highest - 6 in 2003, and the lowest 0 in 2005. The trend for fatalities per 1,000 fire incidents is decreasing. Compared to the Connecticut value the number of fatalities per 1,000 incidents is similar.
According to the data from the years 2003 - 2018 the average number of fire-related yearly deaths is 0. The highest number of deaths - 1 took place in 2003, and the lowest - 0 in 2005. The data has a decreasing trend.
The average number of fatalities per 1,000 fire incidents is 2. This indicator was the highest - 6 in 2003, and the lowest 0 in 2005. The trend for fatalities per 1,000 fire incidents is decreasing. Compared to the Connecticut value the number of fatalities per 1,000 incidents is similar.Deaths per 1,000 incidents in West Hartford, CT compared to nearest cities:
(Note: Based on data for all years, including only cities with at least 2,500 fire incidents)
| West Hartford: | 1.6 |
| Hartford: | 3.0 |
| New Britain: | 1.2 |
| East Hartford: | 1.1 |
| Bristol: | 1.5 |
| Manchester: | 1.7 |
| Middletown: | 0.9 |
| Meriden: | 1.6 |
| Enfield: | 2.5 |
 Based on the reports from the years 2003 - 2018 the average number of fire-related casualties per year is 4. The highest number of reported casualties - 11 took place in 2004, and the lowest - 0 in 2003. The data has a constant trend.
The average number of casualties per 1,000 fires is 17. This indicator was the highest - 48 in 2004, and the lowest 0 in 2003. The trend for casualties per 1,000 incidents is constant. Compared to the state value the number of injuries per 1,000 incidents is higher.
Based on the reports from the years 2003 - 2018 the average number of fire-related casualties per year is 4. The highest number of reported casualties - 11 took place in 2004, and the lowest - 0 in 2003. The data has a constant trend.
The average number of casualties per 1,000 fires is 17. This indicator was the highest - 48 in 2004, and the lowest 0 in 2003. The trend for casualties per 1,000 incidents is constant. Compared to the state value the number of injuries per 1,000 incidents is higher.Casualties per 1,000 incidents in West Hartford, CT compared to nearest cities:
(Note: Based on data for all years, including only cities with at least 500 fire incidents)
| West Hartford: | 18.4 |
| Hartford: | 10.9 |
| Newington: | 2.6 |
| Bloomfield: | 26.3 |
| Wethersfield: | 21.5 |
| Farmington: | 17.2 |
| New Britain: | 21.0 |
| East Hartford: | 34.6 |
| Avon: | 7.6 |
 28.7% incidents where reported in the morning and 71.3% in the evening. The most fires (14.9%) took place on Thursday, and the least (13.7%) on Tuesday.
 According to the 3,090 fires from years 2003 - 2018 most fires (11.3%) took place during May, and the least (5.8%) in February.
 Out of all 43,069 cases reported during the years 2003 - 2018, the most belonged to the categories: Rescue & EMS (49.6%), Hazardous Condition (22.0%), and False Alarm (8.8%).
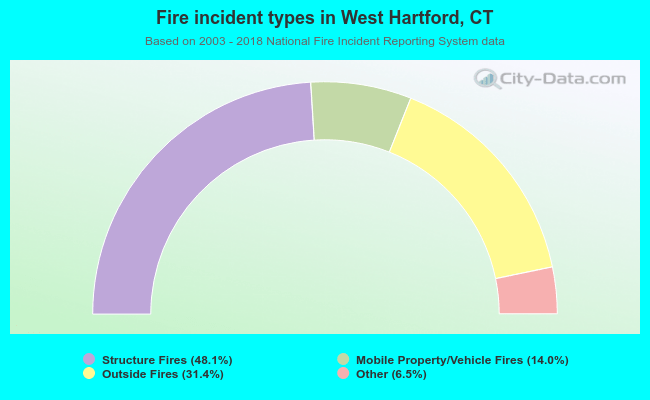 When looking into fire subcategories, the most incidents belonged to: Structure Fires (48.1%), and Outside Fires (31.4%).