Newington: Fire Incidents, Connecticut (CT)
Where are fire incidents reported in Newington, CT
Something went wrong! Please refresh the page.
| Fire incidents reported | |
|---|---|
| Sreet name | Count |
| BERLIN TURN | 182 |
| WILLARD AVEN | 168 |
| CEDAR STRE | 154 |
| BERLIN | 132 |
| MAIN STRE | 110 |
| CEDAR STREET ST | 92 |
| MOUNTAIN ROAD | 86 |
| FENN ROAD | 58 |
| WILLARD AVE | 58 |
| MILL STREET EXT EXT | 52 |
| BERLIN TPKE | 50 |
| BERLIN TURNPIKE TPKE | 48 |
| NEW BRITAIN AVEN | 44 |
| MILL STRE | 42 |
| CEDAR ST | 38 |
| MAIN ST | 38 |
| MAIN STREET ST | 32 |
| CEDAR | 30 |
| RUSSELL ROAD | 30 |
| CHURCH STRE | 26 |
| GARFIELD STRE | 26 |
| HARTFORD AVEN | 26 |
| MOUNTAIN ROAD RD | 24 |
| ROBBINS AVEN | 24 |
| CHURCH ST | 22 |
| HILL ROAD | 22 |
| JOHN H STEWART DRIV | 22 |
| MAPLE HILL AVEN | 20 |
| CONNECTICUT AVEN | 18 |
| LOWREY PLAC | 18 |
| Other | 239 |
2002 - 2018 National Fire Incident Reporting System (NFIRS) incidents
- Incident types reported to NFIRS in Newington, CT
- 1,93132.6%Fire
- 1,58626.8%False Alarm
- 1,34122.7%Hazardous Condition
- 66411.2%Service Call
- 2263.8%Good Intent Call
- 1272.1%Rescue & EMS
- 290.5%Overpressure Rupture
- 80.1%Special Incident
- 70.1%Severe Weather
- Fire incident types reported to NFIRS in Newington, CT
- 94348.8%Structure Fires
- 58630.3%Outside Fires
- 22811.8%Mobile Property/Vehicle Fires
- 1749.0%Other
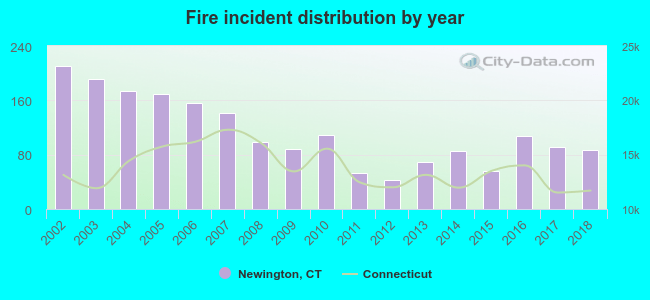 Based on the data from the years 2002 - 2018 the average number of fires per year is 114. The highest number of fires - 211 took place in 2002, and the least - 42 in 2012. The data has a decreasing trend.
The average number of yearly fire incidents per 10k residents in Newington, CT compared to nearest cities:
(Note: Based on data for the last 3 years, including only cities with population 5,000 and above)
| Newington: | 31.2 |
| New Britain: | 45.7 |
| Wethersfield: | 22.0 |
| Rocky Hill: | 51.8 |
| West Hartford: | 28.3 |
| Berlin: | 15.6 |
| Hartford: | 39.1 |
| Cromwell: | 27.8 |
| Farmington: | 22.1 |
 The median response time based on all reported fire incidents is 6 minutes. This is comparable to the Connecticut median value.
The median response time in Newington, CT compared to nearest cities:
(Note: Based on data for all years, including only cities with at least 500 fire incidents)
| Newington: | 6 minutes |
| New Britain: | 4 minutes |
| Wethersfield: | 7 minutes |
| Rocky Hill: | 7 minutes |
| West Hartford: | 4 minutes |
| Berlin: | 6 minutes |
| Hartford: | 4 minutes |
| Cromwell: | 7 minutes |
| Farmington: | 7 minutes |
 Based on the reports from the years 2002 - 2018 the average number of fire-related yearly deaths is 0. The highest number of reported deaths - 2 took place in 2012, and the lowest - 0 in 2002. The data has a constant trend.
 Based on the reports from the years 2002 - 2018 the average number of fire-related casualties per year is 0. The highest number of reported casualties - 1 took place in 2003, and the lowest - 0 in 2002. The data has a constant trend.
The average number of casualties per 1,000 fires is 3. This indicator was the highest - 19 in 2011, and the lowest 0 in 2002. The trend for casualties per 1,000 fires is constant. Compared to the Connecticut value the number of injuries per 1,000 fires is much lower.
Based on the reports from the years 2002 - 2018 the average number of fire-related casualties per year is 0. The highest number of reported casualties - 1 took place in 2003, and the lowest - 0 in 2002. The data has a constant trend.
The average number of casualties per 1,000 fires is 3. This indicator was the highest - 19 in 2011, and the lowest 0 in 2002. The trend for casualties per 1,000 fires is constant. Compared to the Connecticut value the number of injuries per 1,000 fires is much lower.Casualties per 1,000 incidents in Newington, CT compared to nearest cities:
(Note: Based on data for all years, including only cities with at least 500 fire incidents)
| Newington: | 2.6 |
| New Britain: | 21.0 |
| Wethersfield: | 21.5 |
| Rocky Hill: | 7.2 |
| West Hartford: | 18.4 |
| Berlin: | 10.8 |
| Hartford: | 10.9 |
| Cromwell: | 5.4 |
| Farmington: | 17.2 |
 27.9% incidents where reported in the morning and 72.1% in the evening. The most fires (16.8%) took place on Saturday, and the least (12.7%) on Monday.
 According to the 1,931 fires from years 2002 - 2018 most fires (11.2%) took place during April, and the least (6.6%) in August.
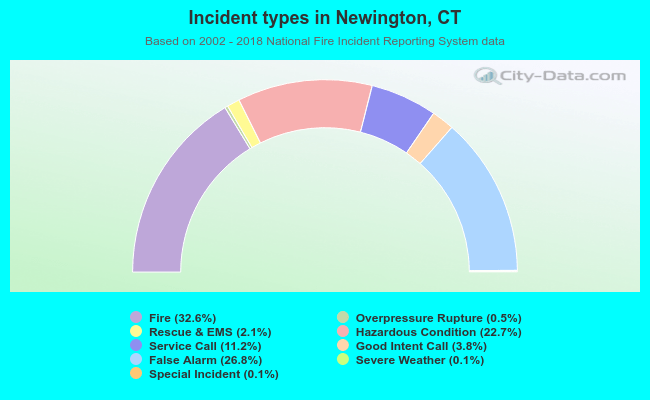 Out of all 5,919 cases reported during the years 2002 - 2018, the most belonged to the categories: Fire (32.6%), False Alarm (26.8%), and Hazardous Condition (22.7%).
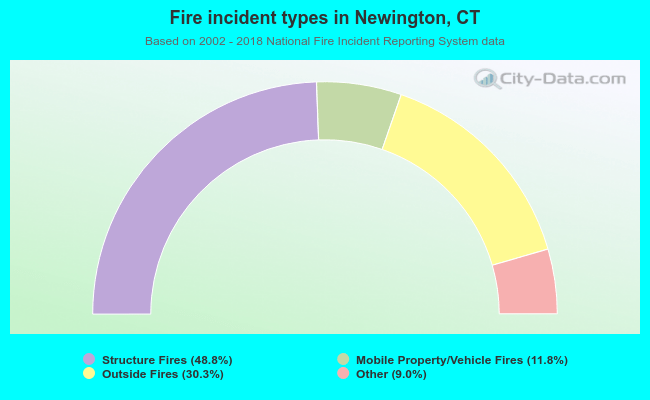 When looking into fire subcategories, the most reports belonged to: Structure Fires (48.8%), and Outside Fires (30.3%).