Cromwell: Fire Incidents, Connecticut (CT)
Where are fire incidents reported in Cromwell, CT
Something went wrong! Please refresh the page.
| Fire incidents reported | |
|---|---|
| Sreet name | Count |
| BERLIN ROAD | 92 |
| SHUNPIKE ROAD | 76 |
| MAIN STREET | 68 |
| ROUTE 9 SOUTH | 66 |
| CROMWELL | 64 |
| WEST STREET | 60 |
| MAIN ST | 58 |
| SHUNPIKE RD | 50 |
| BERLIN RD | 48 |
| I-91 SOUTH | 46 |
| ROUTE 9 NORTH | 46 |
| I-91 NORTH | 42 |
| WEST ST | 40 |
| COURT ST | 32 |
| COLES ROAD | 26 |
| I91 SOUTH | 24 |
| RT 9 NORTH | 24 |
| CROMWELL HILLS DRIVE | 20 |
| NOOKS HILL ROAD | 20 |
| COUNTRY SQUIRE DR | 18 |
| CROMWELL HILLS DR | 18 |
| EVERGREEN RD | 18 |
| RT 9 SOUTH | 18 |
| WILLOWBROOK ROAD | 18 |
| COURT STREET | 16 |
| WOODLAND DRIVE | 16 |
| I91 NORTH | 14 |
| SEBETHE DRIVE | 14 |
| EVERGREEN ROAD | 12 |
| WASHINGTON ROAD | 12 |
2002 - 2018 National Fire Incident Reporting System (NFIRS) incidents
- Incident types reported to NFIRS in Cromwell, CT
- 7,57861.1%Rescue & EMS
- 1,2199.8%Hazardous Condition
- 9687.8%False Alarm
- 9457.6%Service Call
- 9237.4%Fire
- 7115.7%Good Intent Call
- 390.3%Overpressure Rupture
- Fire incident types reported to NFIRS in Cromwell, CT
- 32034.7%Structure Fires
- 28530.9%Outside Fires
- 23725.7%Mobile Property/Vehicle Fires
- 818.8%Other
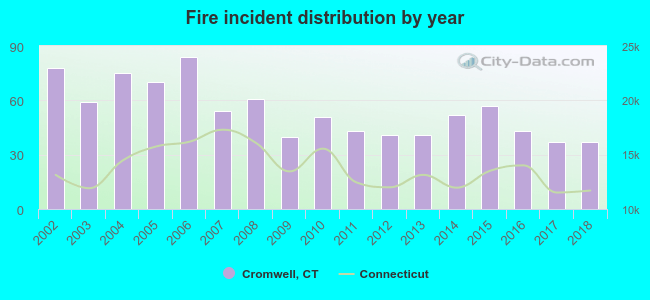 Based on the data from the years 2002 - 2018 the average number of fires per year is 54. The highest number of fires - 84 took place in 2006, and the least - 37 in 2017. The data has a decreasing trend.
The average number of yearly fire incidents per 10k residents in Cromwell, CT compared to nearest cities:
(Note: Based on data for the last 3 years, including only cities with population 5,000 and above)
| Cromwell: | 27.8 |
| Portland: | 59.1 |
| Rocky Hill: | 51.8 |
| Middletown: | 37.9 |
| Berlin: | 15.6 |
| Wethersfield: | 22.0 |
| Newington: | 31.2 |
| New Britain: | 45.7 |
| Glastonbury: | 19.0 |
 The median response time based on all reported fire incidents is 7 minutes. This is higher than the Connecticut median value.
The median response time in Cromwell, CT compared to nearest cities:
(Note: Based on data for all years, including only cities with at least 500 fire incidents)
| Cromwell: | 7 minutes |
| Portland: | 5 minutes |
| Rocky Hill: | 7 minutes |
| Middletown: | 5 minutes |
| Berlin: | 6 minutes |
| Wethersfield: | 7 minutes |
| Newington: | 6 minutes |
| New Britain: | 4 minutes |
| Glastonbury: | 6 minutes |
 Based on the data from the years 2002 - 2018 the average number of fire-related casualties per year is 0. The highest number of casualties - 2 took place in 2014, and the lowest - 0 in 2002. The data has a rising trend.
The average number of injuries per 1,000 fire incidents is 6. This indicator was the highest - 38 in 2014, and the lowest 0 in 2002. The trend for casualties per 1,000 incidents is rising. Compared to the state value the number of casualties per 1,000 fire incidents is much lower.
Based on the data from the years 2002 - 2018 the average number of fire-related casualties per year is 0. The highest number of casualties - 2 took place in 2014, and the lowest - 0 in 2002. The data has a rising trend.
The average number of injuries per 1,000 fire incidents is 6. This indicator was the highest - 38 in 2014, and the lowest 0 in 2002. The trend for casualties per 1,000 incidents is rising. Compared to the state value the number of casualties per 1,000 fire incidents is much lower.Casualties per 1,000 incidents in Cromwell, CT compared to nearest cities:
(Note: Based on data for all years, including only cities with at least 500 fire incidents)
| Cromwell: | 5.4 |
| Portland: | 0.0 |
| Rocky Hill: | 7.2 |
| Middletown: | 8.3 |
| Berlin: | 10.8 |
| Wethersfield: | 21.5 |
| Newington: | 2.6 |
| New Britain: | 21.0 |
| Glastonbury: | 16.7 |
 27.5% incidents where reported in the morning and 72.5% in the evening. The most fires (18.1%) took place on Friday, and the least (11.2%) on Wednesday.
 Based on the 923 fire incidents from years 2002 - 2018 most fires (12.1%) took place during April, and the least (6.2%) in March.
 Out of all 12,400 cases reported during the years 2002 - 2018, the most belonged to the categories: Rescue & EMS (61.1%), Hazardous Condition (9.8%), and False Alarm (7.8%).
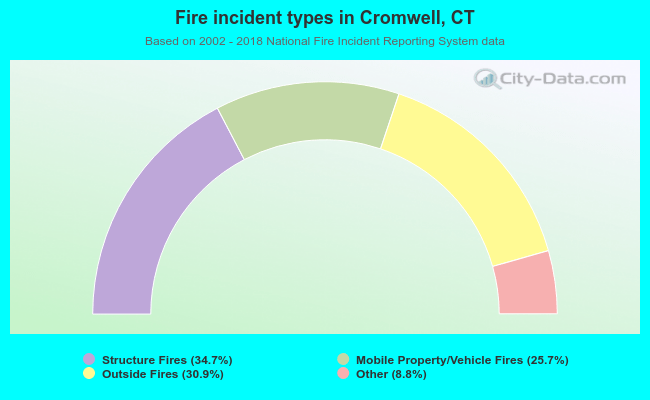 When looking into fire subcategories, the most reports belonged to: Structure Fires (34.7%), and Outside Fires (30.9%).