Glastonbury: Fire Incidents, Connecticut (CT)
Where are fire incidents reported in Glastonbury, CT
Something went wrong! Please refresh the page.
| Fire incidents reported | |
|---|---|
| Sreet name | Count |
| MAIN ST | 240 |
| RT 2 HWY | 172 |
| HEBRON AVE | 112 |
| NEW LONDON TPKE | 78 |
| MANCHESTER RD | 66 |
| GLASTONBURY BLVD | 62 |
| GRISWOLD ST | 54 |
| CHESTNUT HILL RD | 46 |
| ADDISON RD | 44 |
| WELLES ST | 44 |
| TRYON ST | 42 |
| NEW LONDON TPK | 32 |
| NEIPSIC RD | 30 |
| HUBBARD ST | 28 |
| HOPEWELL RD | 26 |
| RT 3 HWY | 24 |
| SALMON BROOK DR | 24 |
| WILLIAMS ST | 24 |
| NAUBUC AVE | 22 |
| OLDE STAGE RD | 22 |
| OAK ST | 20 |
| SPRING ST | 20 |
| THOMPSON ST | 20 |
| BIRCH MOUNTAIN RD | 18 |
| MARLBOROUGH RD | 18 |
| OAKWOOD DR | 18 |
| TOLLGATE RD | 18 |
| CHIMNEYSWEEP HILL RD | 16 |
| FOOTE RD | 16 |
| GEORGETOWN DR | 16 |
| Other | 122 |
2002 - 2018 National Fire Incident Reporting System (NFIRS) incidents
- Incident types reported to NFIRS in Glastonbury, CT
- 3,61642.2%Hazardous Condition
- 1,55318.1%False Alarm
- 1,49417.4%Fire
- 6457.5%Service Call
- 6337.4%Rescue & EMS
- 4745.5%Good Intent Call
- 921.1%Special Incident
- 280.3%Overpressure Rupture
- 270.3%Severe Weather
- Fire incident types reported to NFIRS in Glastonbury, CT
- 63342.4%Structure Fires
- 47631.9%Outside Fires
- 25817.3%Mobile Property/Vehicle Fires
- 1278.5%Other
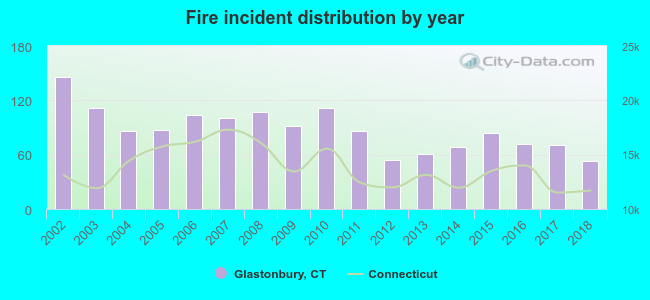 According to the data from the years 2002 - 2018 the average number of fire incidents per year is 88. The highest number of reported fire incidents - 146 took place in 2002, and the least - 53 in 2018. The data has a decreasing trend.
The average number of yearly fire incidents per 10k residents in Glastonbury, CT compared to nearest cities:
(Note: Based on data for the last 3 years, including only cities with population 5,000 and above)
| Glastonbury: | 19.0 |
| East Hartford: | 37.3 |
| Rocky Hill: | 51.8 |
| Wethersfield: | 22.0 |
| Manchester: | 29.6 |
| Marlborough: | 23.9 |
| Hartford: | 39.1 |
| Cromwell: | 27.8 |
| Newington: | 31.2 |
 The median response time based on all reported fire incidents is 6 minutes. This is close to the Connecticut median value.
The median response time in Glastonbury, CT compared to nearest cities:
(Note: Based on data for all years, including only cities with at least 500 fire incidents)
| Glastonbury: | 6 minutes |
| East Hartford: | 4 minutes |
| Rocky Hill: | 7 minutes |
| Wethersfield: | 7 minutes |
| Manchester: | 4 minutes |
| Hartford: | 4 minutes |
| Cromwell: | 7 minutes |
| Newington: | 6 minutes |
| Portland: | 5 minutes |
 Based on the data from the years 2002 - 2018 the average number of fire-related yearly deaths is 0. The highest number of reported deaths - 1 took place in 2003, and the lowest - 0 in 2002. The data has a constant trend.
 According to the data from the years 2002 - 2018 the average number of fire-related yearly casualties is 1. The highest number of reported injuries - 3 took place in 2004, and the lowest - 0 in 2005. The data has a constant trend.
The average number of casualties per 1,000 fire incidents is 19. This indicator was the highest - 43 in 2014, and the lowest 0 in 2005. The trend for casualties per 1,000 fire incidents is rising. Compared to the Connecticut value the number of injuries per 1,000 fire incidents is higher.
According to the data from the years 2002 - 2018 the average number of fire-related yearly casualties is 1. The highest number of reported injuries - 3 took place in 2004, and the lowest - 0 in 2005. The data has a constant trend.
The average number of casualties per 1,000 fire incidents is 19. This indicator was the highest - 43 in 2014, and the lowest 0 in 2005. The trend for casualties per 1,000 fire incidents is rising. Compared to the Connecticut value the number of injuries per 1,000 fire incidents is higher.Casualties per 1,000 incidents in Glastonbury, CT compared to nearest cities:
(Note: Based on data for all years, including only cities with at least 500 fire incidents)
| Glastonbury: | 16.7 |
| East Hartford: | 34.6 |
| Rocky Hill: | 7.2 |
| Wethersfield: | 21.5 |
| Manchester: | 28.9 |
| Hartford: | 10.9 |
| Cromwell: | 5.4 |
| Newington: | 2.6 |
| Portland: | 0.0 |
 28.4% incidents where reported in the morning and 71.6% in the evening. The most fires (15.2%) took place on Saturday, and the least (12.9%) on Tuesday.
 According to the 1,494 fire incident reports from years 2002 - 2018 most fires (11.3%) took place during May, and the least (6.5%) in October.
 Out of all 8,562 cases reported during the years 2002 - 2018, the most belonged to the categories: Hazardous Condition (42.2%), False Alarm (18.1%), and Fire (17.4%).
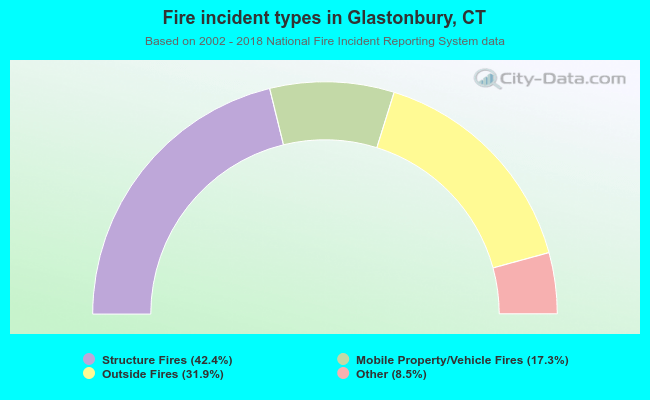 When looking into fire subcategories, the most incidents belonged to: Structure Fires (42.4%), and Outside Fires (31.9%).