Manchester: Fire Incidents, Connecticut (CT)
Where are fire incidents reported in Manchester, CT
Something went wrong! Please refresh the page.
| Fire incidents reported | |
|---|---|
| Sreet name | Count |
| MIDDLE TPKE | 236 |
| CENTER ST | 234 |
| MAIN ST | 210 |
| BUCKLAND HILLS DR. | 190 |
| TOLLAND TPKE | 172 |
| BROAD ST | 150 |
| BUCKLAND HILLS DR | 126 |
| SPENCER ST | 92 |
| BUCKLAND ST. | 88 |
| OAKLAND ST | 88 |
| SPRUCE ST | 80 |
| TOLLAND TPKE | 78 |
| INTERSTATE 84 EAST HWY | 74 |
| PINE ST | 66 |
| HARTFORD RD | 60 |
| OAKLAND ST | 60 |
| NORTH MAIN ST. | 58 |
| BUCKLAND ST | 56 |
| TUDOR LA. | 54 |
| I-384 | 52 |
| CHARTER OAK ST | 50 |
| OAK ST | 50 |
| SPRING ST | 50 |
| VERNON ST | 50 |
| MIDDLE TPKE. WEST | 48 |
| PLEASANT VALLEY RD. | 48 |
| HALE RD | 46 |
| PEARL ST | 46 |
| PLEASANT VALLEY RD | 46 |
| ELM ST | 44 |
| Other | 795 |
2002 - 2018 National Fire Incident Reporting System (NFIRS) incidents
- Incident types reported to NFIRS in Manchester, CT
- 38,46665.3%Rescue & EMS
- 6,69711.4%Hazardous Condition
- 3,5476.0%False Alarm
- 3,4975.9%Fire
- 3,4575.9%Good Intent Call
- 3,0735.2%Service Call
- 820.1%Overpressure Rupture
- Fire incident types reported to NFIRS in Manchester, CT
- 1,41940.6%Structure Fires
- 1,22735.1%Outside Fires
- 64518.4%Mobile Property/Vehicle Fires
- 2065.9%Other
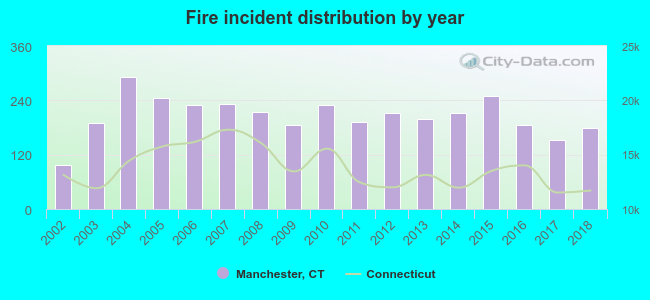 According to the data from the years 2002 - 2018 the average number of fires per year is 206. The highest number of reported fire incidents - 292 took place in 2004, and the least - 97 in 2002. The data has a growing trend.
The average number of yearly fire incidents per 10k residents in Manchester, CT compared to nearest cities:
(Note: Based on data for the last 3 years, including only cities with population 5,000 and above)
| Manchester: | 29.6 |
| South Windsor: | 16.3 |
| East Hartford: | 37.3 |
| Vernon: | 18.4 |
| Glastonbury: | 19.0 |
| Hartford: | 39.1 |
| East Windsor: | 4.8 |
| Windsor: | 48.0 |
| Wethersfield: | 22.0 |
 The median response time based on all reported fire incidents is 4 minutes. This is lower compared to the state median value.
The median response time in Manchester, CT compared to nearest cities:
(Note: Based on data for all years, including only cities with at least 500 fire incidents)
| Manchester: | 4 minutes |
| South Windsor: | 7 minutes |
| East Hartford: | 4 minutes |
| Vernon: | 5 minutes |
| Glastonbury: | 6 minutes |
| Hartford: | 4 minutes |
| Windsor: | 6 minutes |
| Wethersfield: | 7 minutes |
| Coventry: | 7 minutes |
 According to the reports from the years 2002 - 2018 the average number of fire-related fatalities per year is 0. The highest number of reported deaths - 1 took place in 2002, and the lowest - 0 in 2003. The data has a dropping trend.
The average number of deaths per 1,000 fire incidents is 2. This indicator was the highest - 10 in 2002, and the lowest 0 in 2003. The trend for fatalities per 1,000 incidents is declining. Compared to the state value the number of fatalities per 1,000 fires is similar.
According to the reports from the years 2002 - 2018 the average number of fire-related fatalities per year is 0. The highest number of reported deaths - 1 took place in 2002, and the lowest - 0 in 2003. The data has a dropping trend.
The average number of deaths per 1,000 fire incidents is 2. This indicator was the highest - 10 in 2002, and the lowest 0 in 2003. The trend for fatalities per 1,000 incidents is declining. Compared to the state value the number of fatalities per 1,000 fires is similar.Deaths per 1,000 incidents in Manchester, CT compared to nearest cities:
(Note: Based on data for all years, including only cities with at least 2,500 fire incidents)
| Manchester: | 1.7 |
| East Hartford: | 1.1 |
| Hartford: | 3.0 |
| West Hartford: | 1.6 |
| Enfield: | 2.5 |
| New Britain: | 1.2 |
| Middletown: | 0.9 |
 According to the data from the years 2002 - 2018 the average number of fire-related casualties per year is 6. The highest number of casualties - 14 took place in 2011, and the lowest - 1 in 2014. The data has a growing trend.
The average number of injuries per 1,000 fire incidents is 29. This indicator was the highest - 73 in 2011, and the lowest 4 in 2015. The trend for casualties per 1,000 fires is increasing. Compared to the state value the number of casualties per 1,000 incidents is much higher.
According to the data from the years 2002 - 2018 the average number of fire-related casualties per year is 6. The highest number of casualties - 14 took place in 2011, and the lowest - 1 in 2014. The data has a growing trend.
The average number of injuries per 1,000 fire incidents is 29. This indicator was the highest - 73 in 2011, and the lowest 4 in 2015. The trend for casualties per 1,000 fires is increasing. Compared to the state value the number of casualties per 1,000 incidents is much higher.Casualties per 1,000 incidents in Manchester, CT compared to nearest cities:
(Note: Based on data for all years, including only cities with at least 500 fire incidents)
| Manchester: | 28.9 |
| South Windsor: | 7.0 |
| East Hartford: | 34.6 |
| Vernon: | 9.4 |
| Glastonbury: | 16.7 |
| Hartford: | 10.9 |
| Windsor: | 1.1 |
| Wethersfield: | 21.5 |
| Coventry: | 9.6 |
 27.7% incidents where reported in the morning and 72.3% in the evening. The most fires (15.8%) took place on Saturday, and the least (13.4%) on Thursday.
 According to the 3,497 fires from years 2002 - 2018 most fires (10.9%) took place during May, and the least (6.4%) in December.
 Out of all 58,882 cases reported during the years 2002 - 2018, the most belonged to the categories: Rescue & EMS (65.3%), Hazardous Condition (11.4%), and False Alarm (6.0%).
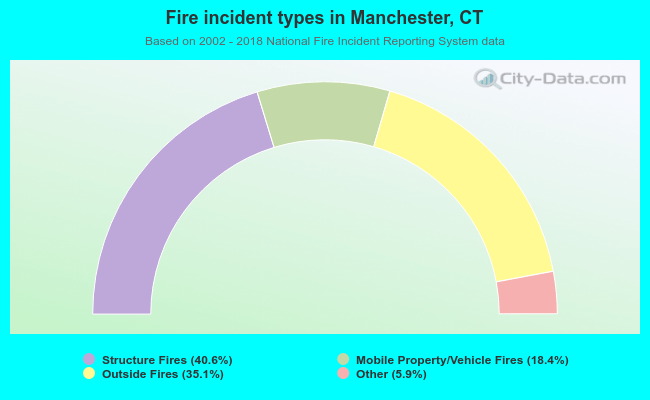 When looking into fire subcategories, the most incidents belonged to: Structure Fires (40.6%), and Outside Fires (35.1%).