Enfield: Fire Incidents, Connecticut (CT)
Where are fire incidents reported in Enfield, CT
Something went wrong! Please refresh the page.
| Fire incidents reported | |
|---|---|
| Sreet name | Count |
| HAZARD AVE | 394 |
| ELM ST | 350 |
| ENFIELD ST | 284 |
| PALOMBA DR | 210 |
| WINDSOR CT | 140 |
| HAZARD AVE | 132 |
| ENFIELD ST | 102 |
| SHAKER RD | 96 |
| ELM ST | 90 |
| PEARL ST | 90 |
| HAZARD AVENUE AVE | 88 |
| SOUTH RD | 88 |
| KING ST | 74 |
| BRAINARD RD | 66 |
| RAFFIA RD | 52 |
| WOODSIDE PARK | 50 |
| MOODY RD | 46 |
| ENFIELD TER | 44 |
| MAIN ST | 44 |
| CHURCH ST | 38 |
| I91 EXIT 46 TO 47 | 36 |
| CENTRAL ST | 34 |
| SHAKER RD | 34 |
| SOUTH RD | 34 |
| PEARL ST | 32 |
| PROSPECT ST | 32 |
| SOUTH ST | 32 |
| ABBE RD | 30 |
| ALDEN AVE | 30 |
| BROAD BROOK RD | 30 |
| Other | 851 |
2002 - 2018 National Fire Incident Reporting System (NFIRS) incidents
- Incident types reported to NFIRS in Enfield, CT
- 17,80645.6%Rescue & EMS
- 7,30418.7%Service Call
- 5,82314.9%Hazardous Condition
- 3,6539.3%Fire
- 2,5236.5%False Alarm
- 1,8144.6%Good Intent Call
- 770.2%Special Incident
- 630.2%Overpressure Rupture
- Fire incident types reported to NFIRS in Enfield, CT
- 1,93653.0%Structure Fires
- 97126.6%Outside Fires
- 48513.3%Mobile Property/Vehicle Fires
- 2617.1%Other
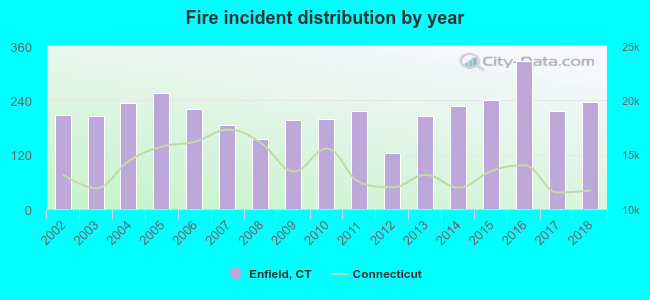 According to the data from the years 2002 - 2018 the average number of fire incidents per year is 215. The highest number of fires - 326 took place in 2016, and the least - 123 in 2012. The data has a growing trend.
The average number of yearly fire incidents per 10k residents in Enfield, CT compared to nearest cities:
(Note: Based on data for the last 3 years, including only cities with population 5,000 and above)
| Enfield: | 58.1 |
| Suffield: | 32.0 |
| East Windsor: | 4.8 |
| Somers: | 25.6 |
| Windsor Locks: | 41.3 |
| Ellington: | 14.3 |
| Windsor: | 48.0 |
| East Granby: | 93.2 |
| South Windsor: | 16.3 |
 The median response time based on all reported fire incidents is 4 minutes. This is lower than the Connecticut median value.
The median response time in Enfield, CT compared to nearest cities:
(Note: Based on data for all years, including only cities with at least 500 fire incidents)
| Enfield: | 4 minutes |
| Suffield: | 5 minutes |
| Somers: | 6 minutes |
| Windsor Locks: | 6 minutes |
| Ellington: | 6 minutes |
| Windsor: | 6 minutes |
| East Granby: | 7 minutes |
| South Windsor: | 7 minutes |
| Vernon: | 5 minutes |
 According to the data from the years 2002 - 2018 the average number of fire-related yearly deaths is 1. The highest number of deaths - 4 took place in 2014, and the lowest - 0 in 2003. The data has a constant trend.
The average number of deaths per 1,000 fires is 3. This indicator was the highest - 18 in 2014, and the lowest 0 in 2003. The trend for deaths per 1,000 fire incidents is decreasing. Compared to the Connecticut value the number of deaths per 1,000 fire incidents is higher.
According to the data from the years 2002 - 2018 the average number of fire-related yearly deaths is 1. The highest number of deaths - 4 took place in 2014, and the lowest - 0 in 2003. The data has a constant trend.
The average number of deaths per 1,000 fires is 3. This indicator was the highest - 18 in 2014, and the lowest 0 in 2003. The trend for deaths per 1,000 fire incidents is decreasing. Compared to the Connecticut value the number of deaths per 1,000 fire incidents is higher.Deaths per 1,000 incidents in Enfield, CT compared to nearest cities:
(Note: Based on data for all years, including only cities with at least 2,500 fire incidents)
| Enfield: | 2.5 |
| Manchester: | 1.7 |
| East Hartford: | 1.1 |
| Hartford: | 3.0 |
| West Hartford: | 1.6 |
 Based on the data from the years 2002 - 2018 the average number of fire-related casualties per year is 3. The highest number of injuries - 7 took place in 2014, and the lowest - 0 in 2005. The data has a growing trend.
The average number of injuries per 1,000 fires is 14. This indicator was the highest - 31 in 2014, and the lowest 0 in 2005. The trend for injuries per 1,000 incidents is rising. Compared to the state value the number of casualties per 1,000 fires is higher.
Based on the data from the years 2002 - 2018 the average number of fire-related casualties per year is 3. The highest number of injuries - 7 took place in 2014, and the lowest - 0 in 2005. The data has a growing trend.
The average number of injuries per 1,000 fires is 14. This indicator was the highest - 31 in 2014, and the lowest 0 in 2005. The trend for injuries per 1,000 incidents is rising. Compared to the state value the number of casualties per 1,000 fires is higher.Casualties per 1,000 incidents in Enfield, CT compared to nearest cities:
(Note: Based on data for all years, including only cities with at least 500 fire incidents)
| Enfield: | 14.8 |
| Suffield: | 24.7 |
| Somers: | 33.8 |
| Windsor Locks: | 13.6 |
| Ellington: | 9.8 |
| Windsor: | 1.1 |
| East Granby: | 9.0 |
| South Windsor: | 7.0 |
| Vernon: | 9.4 |
 29.7% incidents where reported in the morning and 70.3% in the evening. The most fires (14.9%) took place on Thursday, and the least (13.6%) on Monday.
 Based on the 3,653 fires from years 2002 - 2018 most fires (10.0%) took place during July, and the least (6.5%) in February.
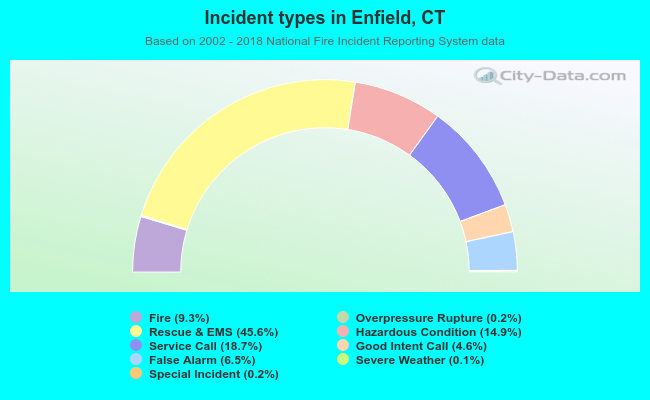 Out of all 39,087 cases reported during the years 2002 - 2018, the most belonged to the categories: Rescue & EMS (45.6%), Service Call (18.7%), and Hazardous Condition (14.9%).
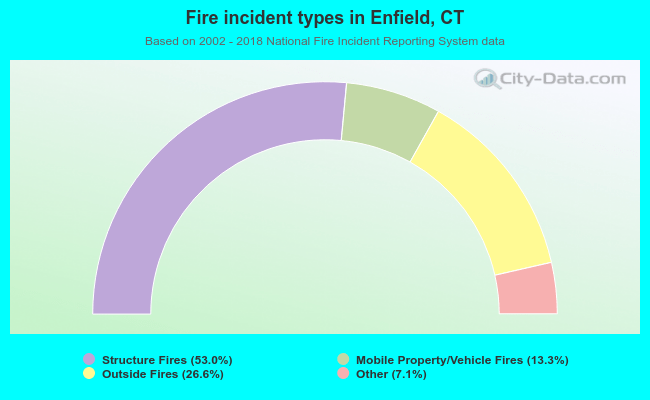 When looking into fire subcategories, the most incidents belonged to: Structure Fires (53.0%), and Outside Fires (26.6%).