Windsor Locks: Fire Incidents, Connecticut (CT)
Where are fire incidents reported in Windsor Locks, CT
Something went wrong! Please refresh the page.
| Fire incidents reported | |
|---|---|
| Sreet name | Count |
| ELLA GRASSO TPKE | 136 |
| SPRING ST | 96 |
| ELM ST | 88 |
| MAIN ST | 82 |
| OLD COUNTY RD | 76 |
| GROVE ST | 68 |
| SOUTH ELM ST | 64 |
| CANAL BANK RD | 62 |
| BRADLEY INT'L AIRPORT | 60 |
| NORTH ST | 46 |
| CENTER ST | 44 |
| BRADLEY INTL AIRPORT | 40 |
| SOUTHWEST AVE | 36 |
| CHESTNUT ST | 32 |
| SCHOEPHESTER RD | 30 |
| NORTH MAIN ST | 26 |
| RT 20 | 24 |
| SOUTH CENTER ST | 24 |
| SCHOEPHOESTER RD | 22 |
| CONCORDE WAY | 20 |
| SOUTH MAIN ST | 20 |
| I-91 HWY | 18 |
| RT. 20 | 18 |
| SOUTH ST | 18 |
| SUFFIELD ST | 18 |
| KING SPRING RD | 16 |
| OAK ST | 16 |
| REED AVE | 16 |
| DENSLOW ST | 14 |
| I91 HWY | 14 |
2003 - 2018 National Fire Incident Reporting System (NFIRS) incidents
- Incident types reported to NFIRS in Windsor Locks, CT
- 5,18454.4%Hazardous Condition
- 1,64917.3%Rescue & EMS
- 1,02910.8%Fire
- 8038.4%False Alarm
- 5375.6%Service Call
- 2682.8%Good Intent Call
- 450.5%Special Incident
- 180.2%Overpressure Rupture
- Fire incident types reported to NFIRS in Windsor Locks, CT
- 39338.2%Structure Fires
- 34833.8%Outside Fires
- 19919.3%Mobile Property/Vehicle Fires
- 898.6%Other
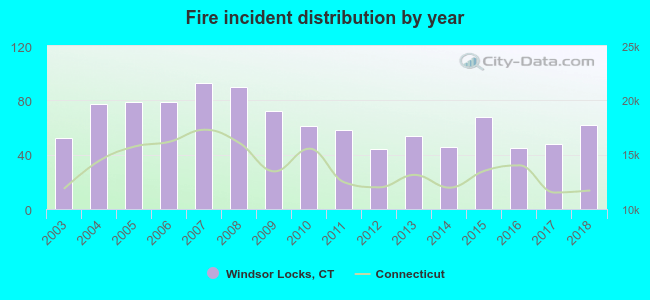 Based on the data from the years 2003 - 2018 the average number of fire incidents per year is 64. The highest number of fires - 93 took place in 2007, and the least - 44 in 2012. The data has a growing trend.
The average number of yearly fire incidents per 10k residents in Windsor Locks, CT compared to nearest cities:
(Note: Based on data for the last 3 years, including only cities with population 5,000 and above)
| Windsor Locks: | 41.3 |
| Suffield: | 32.0 |
| East Windsor: | 4.8 |
| Windsor: | 48.0 |
| East Granby: | 93.2 |
| Enfield: | 58.1 |
| South Windsor: | 16.3 |
| Bloomfield: | 50.8 |
| Granby: | 28.4 |
 The median response time based on all reported fire incidents is 6 minutes. This is about the same as the Connecticut median value.
The median response time in Windsor Locks, CT compared to nearest cities:
(Note: Based on data for all years, including only cities with at least 500 fire incidents)
| Windsor Locks: | 6 minutes |
| Suffield: | 5 minutes |
| Windsor: | 6 minutes |
| East Granby: | 7 minutes |
| Enfield: | 4 minutes |
| South Windsor: | 7 minutes |
| Bloomfield: | 6 minutes |
| Granby: | 7 minutes |
| Simsbury: | 5 minutes |
 Based on the reports from the years 2003 - 2018 the average number of fire-related casualties per year is 1. The highest number of reported injuries - 4 took place in 2008, and the lowest - 0 in 2003. The data has a constant trend.
The average number of casualties per 1,000 fires is 11. This indicator was the highest - 44 in 2008, and the lowest 0 in 2003. The trend for casualties per 1,000 incidents is constant. Compared to the Connecticut value the number of casualties per 1,000 fires is about the same.
Based on the reports from the years 2003 - 2018 the average number of fire-related casualties per year is 1. The highest number of reported injuries - 4 took place in 2008, and the lowest - 0 in 2003. The data has a constant trend.
The average number of casualties per 1,000 fires is 11. This indicator was the highest - 44 in 2008, and the lowest 0 in 2003. The trend for casualties per 1,000 incidents is constant. Compared to the Connecticut value the number of casualties per 1,000 fires is about the same.Casualties per 1,000 incidents in Windsor Locks, CT compared to nearest cities:
(Note: Based on data for all years, including only cities with at least 500 fire incidents)
| Windsor Locks: | 13.6 |
| Suffield: | 24.7 |
| Windsor: | 1.1 |
| East Granby: | 9.0 |
| Enfield: | 14.8 |
| South Windsor: | 7.0 |
| Bloomfield: | 26.3 |
| Granby: | 0.0 |
| Simsbury: | 6.9 |
 30.3% incidents where reported in the morning and 69.7% in the evening. The most fires (15.0%) took place on Sunday, and the least (12.4%) on Thursday.
 According to the 1,029 fire incident reports from years 2003 - 2018 most fires (12.0%) took place during April, and the least (5.6%) in February.
 Out of all 9,535 cases reported during the years 2003 - 2018, the most belonged to the categories: Hazardous Condition (54.4%), Rescue & EMS (17.3%), and Fire (10.8%).
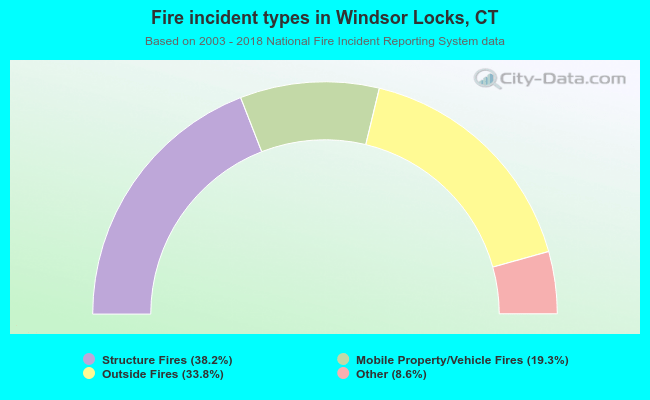 When looking into fire subcategories, the most reports belonged to: Structure Fires (38.2%), and Outside Fires (33.8%).