Farmington: Fire Incidents, Connecticut (CT)
Where are fire incidents reported in Farmington, CT
Something went wrong! Please refresh the page.
| Fire incidents reported | |
|---|---|
| Sreet name | Count |
| FARMINGTON AVE | 254 |
| MAIN ST | 172 |
| SCOTT SWAMP RD | 112 |
| COLT HWY | 98 |
| SOUTH RD | 86 |
| SOUTHEAST RD | 52 |
| I84 HWY | 50 |
| NEW BRITAIN AVE | 48 |
| BATTERSON PARK RD | 44 |
| FARMINGTON AVE AVE | 40 |
| I-84 | 38 |
| PLAINVILLE AVE | 38 |
| OLD MOUNTAIN RD | 32 |
| GARDEN ST | 30 |
| I-84 HWY | 30 |
| TALCOTT NOTCH RD | 28 |
| FARM SPRINGS RD | 26 |
| MIDDLE RD | 26 |
| MOUNTAIN SPRING RD | 26 |
| TUNXIS MEAD RD | 26 |
| FARM GLEN BLVD | 24 |
| I-84 HWY HWY | 24 |
| BRICKYARD RD | 22 |
| FOREST HILLS DR | 22 |
| MEADOW RD | 22 |
| TALCOTT FOREST RD | 22 |
| MOUNTAIN RD | 20 |
| SPRING LA | 20 |
| WATERVILLE RD | 20 |
| BIRDSEYE RD | 18 |
2002 - 2018 National Fire Incident Reporting System (NFIRS) incidents
- Incident types reported to NFIRS in Farmington, CT
- 12,70260.4%Rescue & EMS
- 2,51912.0%Hazardous Condition
- 2,28510.9%Good Intent Call
- 1,3986.6%False Alarm
- 1,3936.6%Fire
- 6963.3%Service Call
- Fire incident types reported to NFIRS in Farmington, CT
- 60443.4%Structure Fires
- 43030.9%Outside Fires
- 28120.2%Mobile Property/Vehicle Fires
- 785.6%Other
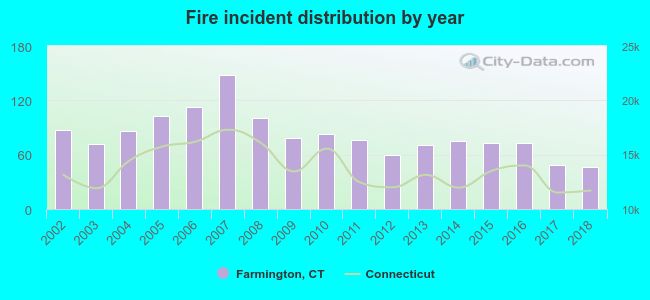 According to the data from the years 2002 - 2018 the average number of fire incidents per year is 82. The highest number of reported fire incidents - 148 took place in 2007, and the least - 46 in 2018. The data has a decreasing trend.
The average number of yearly fire incidents per 10k residents in Farmington, CT compared to nearest cities:
(Note: Based on data for the last 3 years, including only cities with population 5,000 and above)
| Farmington: | 22.1 |
| Avon: | 25.6 |
| Plainville: | 43.1 |
| Burlington: | 28.7 |
| New Britain: | 45.7 |
| Bristol: | 35.6 |
| West Hartford: | 28.3 |
| Newington: | 31.2 |
| Canton: | 38.2 |
 The median response time based on all reported fire incidents is 7 minutes. This is higher than the Connecticut median value.
The median response time in Farmington, CT compared to nearest cities:
(Note: Based on data for all years, including only cities with at least 500 fire incidents)
| Farmington: | 7 minutes |
| Avon: | 7 minutes |
| Plainville: | 5 minutes |
| New Britain: | 4 minutes |
| Bristol: | 4 minutes |
| West Hartford: | 4 minutes |
| Newington: | 6 minutes |
| Hartford: | 4 minutes |
| Berlin: | 6 minutes |
 Based on the data from the years 2002 - 2018 the average number of fire-related yearly casualties is 1. The highest number of reported casualties - 6 took place in 2007, and the lowest - 0 in 2003. The data has a constant trend.
The average number of casualties per 1,000 fires is 16. This indicator was the highest - 41 in 2015, and the lowest 0 in 2003. The trend for casualties per 1,000 fire incidents is growing. Compared to the Connecticut value the number of casualties per 1,000 incidents is higher.
Based on the data from the years 2002 - 2018 the average number of fire-related yearly casualties is 1. The highest number of reported casualties - 6 took place in 2007, and the lowest - 0 in 2003. The data has a constant trend.
The average number of casualties per 1,000 fires is 16. This indicator was the highest - 41 in 2015, and the lowest 0 in 2003. The trend for casualties per 1,000 fire incidents is growing. Compared to the Connecticut value the number of casualties per 1,000 incidents is higher.Casualties per 1,000 incidents in Farmington, CT compared to nearest cities:
(Note: Based on data for all years, including only cities with at least 500 fire incidents)
| Farmington: | 17.2 |
| Avon: | 7.6 |
| Plainville: | 31.2 |
| New Britain: | 21.0 |
| Bristol: | 25.9 |
| West Hartford: | 18.4 |
| Newington: | 2.6 |
| Hartford: | 10.9 |
| Berlin: | 10.8 |
 34.0% incidents where reported in the morning and 66.0% in the evening. The most fires (15.9%) took place on Tuesday, and the least (13.0%) on Sunday.
 According to the 1,393 fire incident reports from years 2002 - 2018 most fires (11.4%) took place during April, and the least (6.3%) in October.
 Out of all 21,027 cases reported during the years 2002 - 2018, the most belonged to the categories: Rescue & EMS (60.4%), Hazardous Condition (12.0%), and Good Intent Call (10.9%).
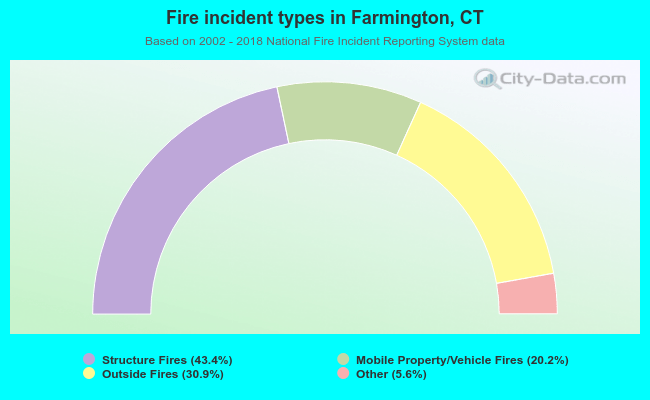 When looking into fire subcategories, the most incidents belonged to: Structure Fires (43.4%), and Outside Fires (30.9%).