Canton: Fire Incidents, Connecticut (CT)
Where are fire incidents reported in Canton, CT
Something went wrong! Please refresh the page.
|
| |||||||||||||||||||||||||||||||||||||||||||||||||||||||||||||||||||||||||||||||||||||||||||||||||||||||||||||
2002 - 2018 National Fire Incident Reporting System (NFIRS) incidents
- Incident types reported to NFIRS in Canton, CT
- 4,32571.9%Rescue & EMS
- 5348.9%Good Intent Call
- 4026.7%Hazardous Condition
- 3375.6%Fire
- 2544.2%False Alarm
- 1482.5%Service Call
- 120.2%Severe Weather
- Fire incident types reported to NFIRS in Canton, CT
- 26678.9%Structure Fires
- 4914.5%Outside Fires
- 205.9%Mobile Property/Vehicle Fires
- 20.6%Other
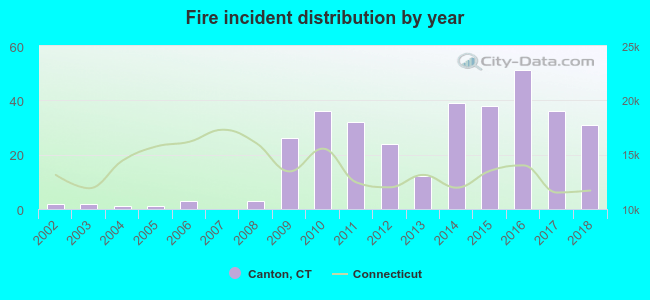 According to the data from the years 2002 - 2018 the average number of fire incidents per year is 20. The highest number of reported fire incidents - 51 took place in 2016, and the least - 0 in 2007. The data has an increasing trend.
The average number of yearly fire incidents per 10k residents in Canton, CT compared to nearest cities:
(Note: Based on data for the last 3 years, including only cities with population 5,000 and above)
| Canton: | 38.2 |
| Avon: | 25.6 |
| New Hartford: | 41.6 |
| Simsbury: | 16.0 |
| Burlington: | 28.7 |
| Farmington: | 22.1 |
| Harwinton: | 42.5 |
| Winsted: | 22.5 |
| Bloomfield: | 50.8 |

 35.6% incidents where reported in the morning and 64.4% in the evening. The most fires (16.3%) took place on Saturday, and the least (12.2%) on Tuesday.
 Based on the 337 fire incidents from years 2002 - 2018 most fires (13.9%) took place during March, and the least (3.0%) in September.
 Out of all 6,012 cases reported during the years 2002 - 2018, the most belonged to the categories: Overpressure Rupture (71.9%), Service Call (8.9%), and Rescue & EMS (6.7%).
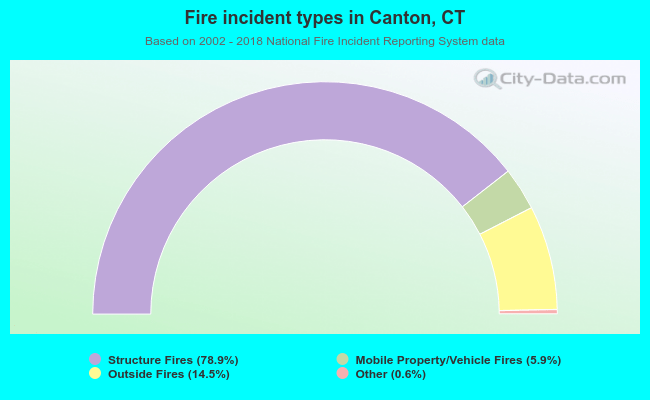 When looking into fire subcategories, the most incidents belonged to: Structure Fires (78.9%), and Outside Fires (14.5%).