Plainville: Fire Incidents, Connecticut (CT)
Where are fire incidents reported in Plainville, CT
Something went wrong! Please refresh the page.
| Fire incidents reported | |
|---|---|
| Sreet name | Count |
| EAST ST | 298 |
| NEW BRITAIN AVE | 258 |
| FARMINGTON AVE | 96 |
| BROAD ST | 82 |
| EAST MAIN ST | 76 |
| WHITING ST | 72 |
| WEST MAIN ST | 70 |
| NORTHWEST DR | 54 |
| SOUTH WASHINGTON ST | 48 |
| STILLWELL DR | 48 |
| NORTH WASHINGTON ST | 46 |
| WOODFORD AVE | 44 |
| INTERSTATE 84 | 34 |
| METACOMET RD | 34 |
| TWINING ST | 32 |
| CAMP ST | 30 |
| REDSTONE HILL | 28 |
| INTERSTATE 72 | 26 |
| MAPLE ST | 26 |
| ROCKWELL AVE | 26 |
| TOMLINSON AVE | 26 |
| UNIONVILLE AVE | 26 |
| NORTON PARK RD | 22 |
| COOKE ST | 20 |
| CAROL DR | 18 |
| FLORENCE LN | 18 |
| LEDGE RD | 18 |
| MAXINE RD | 18 |
| NORTON PL | 18 |
| PERRON RD | 18 |
2002 - 2018 National Fire Incident Reporting System (NFIRS) incidents
- Incident types reported to NFIRS in Plainville, CT
- 1,56229.3%Hazardous Condition
- 1,50628.3%Fire
- 1,02619.3%False Alarm
- 68812.9%Service Call
- 3837.2%Good Intent Call
- 1021.9%Rescue & EMS
- 310.6%Overpressure Rupture
- 140.3%Severe Weather
- 110.2%Special Incident
- Fire incident types reported to NFIRS in Plainville, CT
- 67544.8%Structure Fires
- 42728.4%Outside Fires
- 26117.3%Mobile Property/Vehicle Fires
- 1439.5%Other
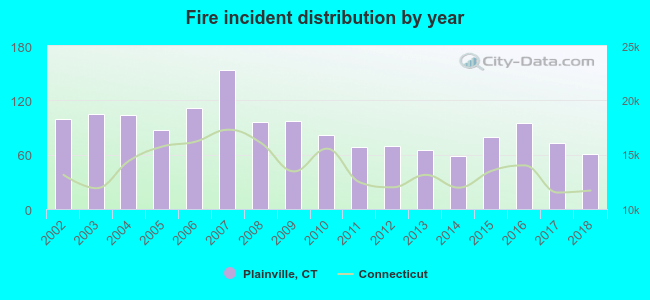 According to the data from the years 2002 - 2018 the average number of fire incidents per year is 89. The highest number of fire incidents - 154 took place in 2007, and the least - 59 in 2014. The data has a dropping trend.
The average number of yearly fire incidents per 10k residents in Plainville, CT compared to nearest cities:
(Note: Based on data for the last 3 years, including only cities with population 5,000 and above)
| Plainville: | 43.1 |
| Bristol: | 35.6 |
| New Britain: | 45.7 |
| Farmington: | 22.1 |
| Southington: | 21.6 |
| Berlin: | 15.6 |
| Newington: | 31.2 |
| Terryville: | 26.0 |
| Burlington: | 28.7 |
 The median response time based on all reported fire incidents is 5 minutes. This is similar to the Connecticut median value.
The median response time in Plainville, CT compared to nearest cities:
(Note: Based on data for all years, including only cities with at least 500 fire incidents)
| Plainville: | 5 minutes |
| Bristol: | 4 minutes |
| New Britain: | 4 minutes |
| Farmington: | 7 minutes |
| Southington: | 6 minutes |
| Berlin: | 6 minutes |
| Newington: | 6 minutes |
| Wolcott: | 5 minutes |
| Avon: | 7 minutes |
 Based on the reports from the years 2002 - 2018 the average number of fire-related fatalities per year is 0. The highest number of reported deaths - 2 took place in 2002, and the lowest - 0 in 2003. The data has a decreasing trend.
 According to the reports from the years 2002 - 2018 the average number of fire-related casualties per year is 3. The highest number of injuries - 8 took place in 2008, and the lowest - 0 in 2017. The data has a declining trend.
The average number of injuries per 1,000 fire incidents is 33. This indicator was the highest - 114 in 2012, and the lowest 0 in 2017. The trend for injuries per 1,000 fire incidents is declining. Compared to the state value the number of injuries per 1,000 incidents is much higher.
According to the reports from the years 2002 - 2018 the average number of fire-related casualties per year is 3. The highest number of injuries - 8 took place in 2008, and the lowest - 0 in 2017. The data has a declining trend.
The average number of injuries per 1,000 fire incidents is 33. This indicator was the highest - 114 in 2012, and the lowest 0 in 2017. The trend for injuries per 1,000 fire incidents is declining. Compared to the state value the number of injuries per 1,000 incidents is much higher.Casualties per 1,000 incidents in Plainville, CT compared to nearest cities:
(Note: Based on data for all years, including only cities with at least 500 fire incidents)
| Plainville: | 31.2 |
| Bristol: | 25.9 |
| New Britain: | 21.0 |
| Farmington: | 17.2 |
| Southington: | 23.5 |
| Berlin: | 10.8 |
| Newington: | 2.6 |
| Wolcott: | 5.0 |
| Avon: | 7.6 |
 29.9% incidents where reported in the morning and 70.1% in the evening. The most fires (15.1%) took place on Wednesday, and the least (13.7%) on Monday.
 According to the 1,506 incident reports from years 2002 - 2018 most fires (12.1%) took place during April, and the least (6.2%) in February.
 Out of all 5,323 cases reported during the years 2002 - 2018, the most belonged to the categories: Hazardous Condition (29.3%), Fire (28.3%), and False Alarm (19.3%).
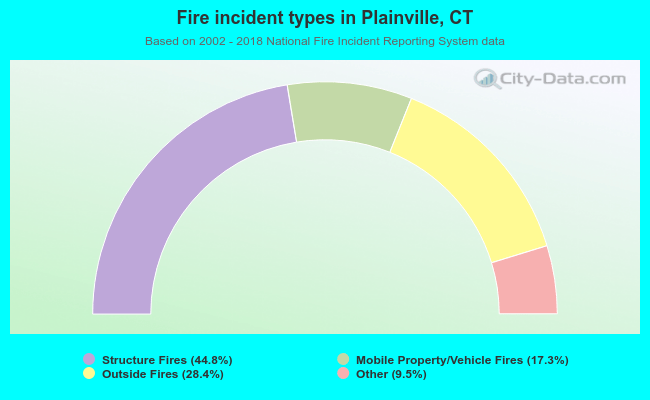 When looking into fire subcategories, the most reports belonged to: Structure Fires (44.8%), and Outside Fires (28.4%).