Pembroke Park: Fire Incidents, Florida (FL)
Where are fire incidents reported in Pembroke Park, FL
Something went wrong! Please refresh the page.
|
| |||||||||||||||||||||||||||||||||||||||||||||||||||||||||||||||||||||||||||||||||||||||||||||||||||||||||||||
2002 - 2018 National Fire Incident Reporting System (NFIRS) incidents
- Incident types reported to NFIRS in Pembroke Park, FL
- 5,48662.7%Rescue & EMS
- 1,33015.2%Good Intent Call
- 5296.0%Hazardous Condition
- 5135.9%Service Call
- 4745.4%Fire
- 4114.7%False Alarm
- Fire incident types reported to NFIRS in Pembroke Park, FL
- 19841.8%Structure Fires
- 15933.5%Mobile Property/Vehicle Fires
- 10522.2%Outside Fires
- 122.5%Other
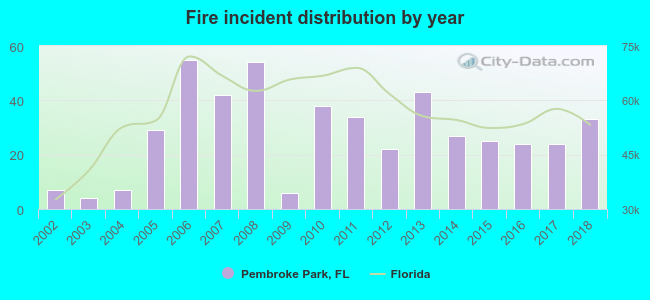 According to the data from the years 2002 - 2018 the average number of fires per year is 28. The highest number of reported fires - 55 took place in 2006, and the least - 4 in 2003. The data has a growing trend.
The average number of yearly fire incidents per 10k residents in Pembroke Park, FL compared to nearest cities:
(Note: Based on data for the last 3 years, including only cities with population 5,000 and above)
| Pembroke Park: | 42.9 |
| West Park: | 27.7 |
| Hallandale Beach: | 0.3 |
| Hallandale: | 24.5 |
| Hollywood: | 20.1 |
| Aventura: | 9.7 |
| North Miami Beach: | 12.4 |
| Sunny Isles Beach: | 12.6 |
| Dania Beach: | 0.5 |
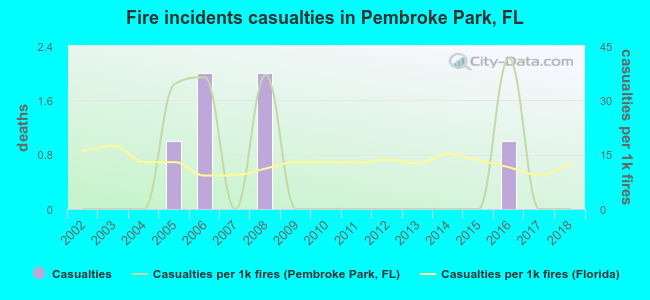 According to the data from the years 2002 - 2018 the average number of fire-related casualties per year is 0. The highest number of injuries - 2 took place in 2006, and the lowest - 0 in 2002. The data has a constant trend.
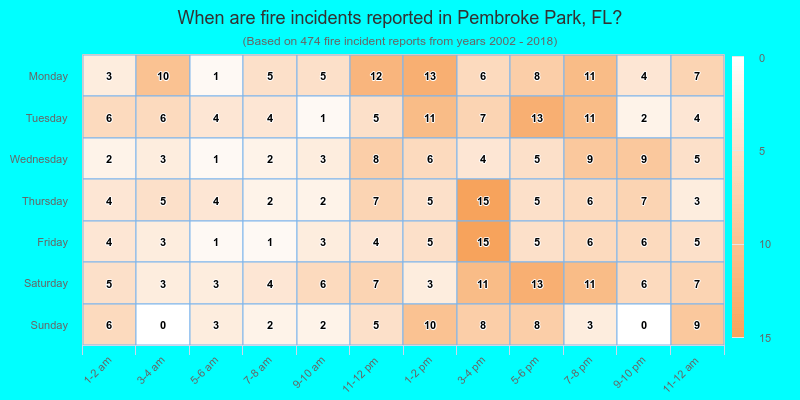
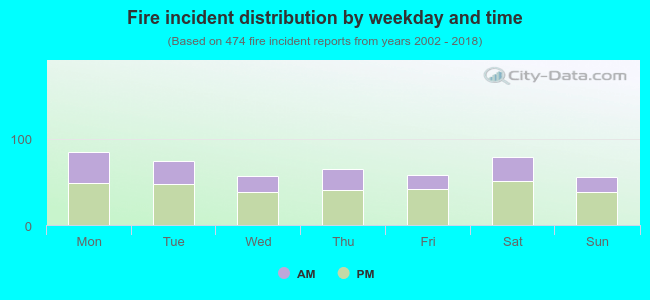 35.2% incidents where reported in the morning and 64.8% in the evening. The most fires (17.9%) took place on Monday, and the least (11.8%) on Sunday.
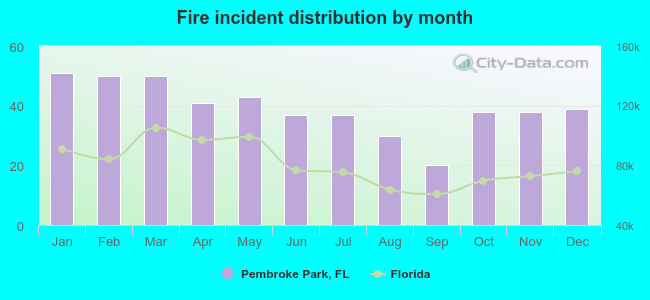 According to the 474 fires from years 2002 - 2018 most fires (10.8%) took place during January, and the least (4.2%) in September.
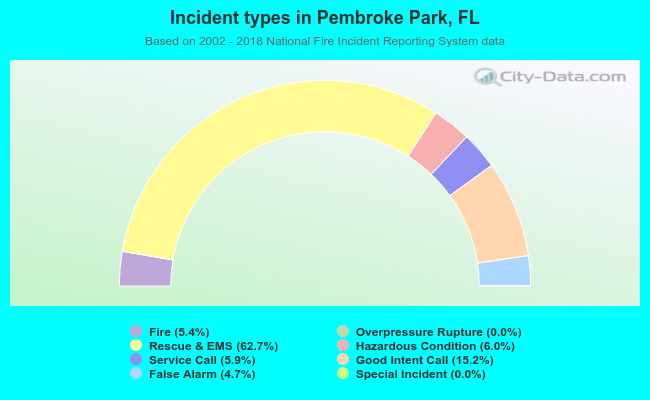 Out of all 8,745 cases reported during the years 2002 - 2018, the most belonged to the categories: Rescue & EMS (62.7%), Good Intent Call (15.2%), and Hazardous Condition (6.0%).
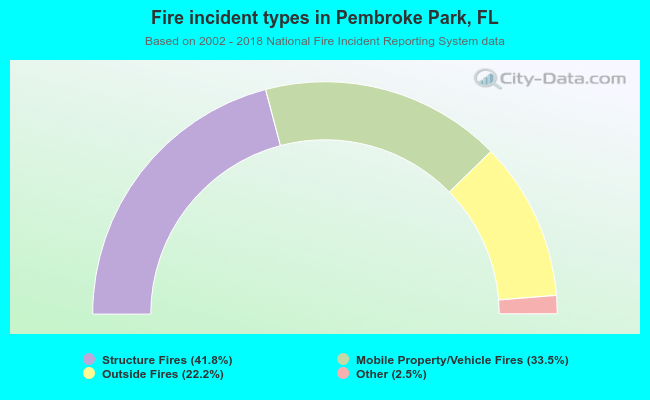 When looking into fire subcategories, the most incidents belonged to: Structure Fires (41.8%), and Mobile Property/Vehicle Fires (33.5%).