Aventura: Fire Incidents, Florida (FL)
Where are fire incidents reported in Aventura, FL
Something went wrong! Please refresh the page.
|
| |||||||||||||||||||||||||||||||||||||||||||||||||||||||||||||||||||||||||||||||||||||||||||||||||||||||||||||
2008 - 2018 National Fire Incident Reporting System (NFIRS) incidents
- Incident types reported to NFIRS in Aventura, FL
- 17,73774.5%Rescue & EMS
- 2,46010.3%False Alarm
- 1,6927.1%Service Call
- 1,1724.9%Good Intent Call
- 4161.7%Fire
- 3361.4%Hazardous Condition
- Fire incident types reported to NFIRS in Aventura, FL
- 17040.9%Structure Fires
- 14334.4%Outside Fires
- 9923.8%Mobile Property/Vehicle Fires
- 41.0%Other
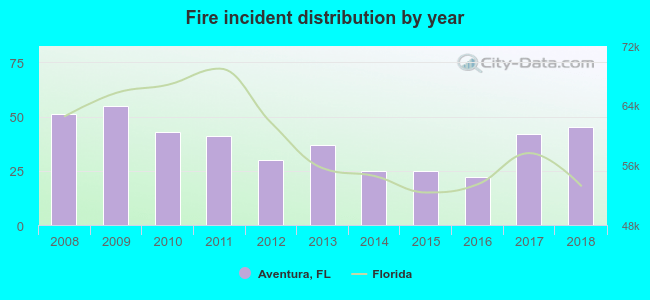 Based on the data from the years 2008 - 2018 the average number of fire incidents per year is 38. The highest number of reported fires - 55 took place in 2009, and the least - 22 in 2016. The data has a dropping trend.
The average number of yearly fire incidents per 10k residents in Aventura, FL compared to nearest cities:
(Note: Based on data for the last 3 years, including only cities with population 5,000 and above)
| Aventura: | 9.7 |
| Hallandale Beach: | 0.3 |
| Hallandale: | 24.5 |
| Sunny Isles Beach: | 12.6 |
| Pembroke Park: | 42.9 |
| North Miami Beach: | 12.4 |
| West Park: | 27.7 |
| Hollywood: | 20.1 |
| Bay Harbor Islands: | 5.0 |

 29.6% incidents where reported in the morning and 70.4% in the evening. The most fires (19.2%) took place on Sunday, and the least (11.1%) on Monday.
 According to the 416 fire incident reports from years 2008 - 2018 most fires (11.5%) took place during April, and the least (6.0%) in September.
 Out of all 23,819 cases reported during the years 2008 - 2018, the most belonged to the categories: Rescue & EMS (74.5%), False Alarm (10.3%), and Service Call (7.1%).
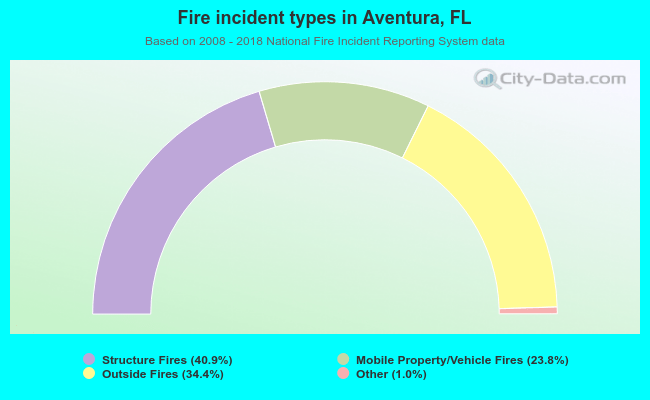 When looking into fire subcategories, the most reports belonged to: Structure Fires (40.9%), and Outside Fires (34.4%).