Hallandale: Fire Incidents, Florida (FL)
Where are fire incidents reported in Hallandale, FL
Something went wrong! Please refresh the page.
| Fire incidents reported | |
|---|---|
| Sreet name | Count |
| OCEAN DR | 358 |
| HALLANDALE BCH | 218 |
| FEDERAL HWY | 196 |
| HALLANDALE BEACH BLVD | 146 |
| THREE ISLANDS BLVD | 112 |
| 8TH AVE | 108 |
| 10TH ST | 98 |
| 8TH ST | 96 |
| 3RD ST | 94 |
| PARKVIEW DR | 94 |
| 4TH ST | 74 |
| 7TH ST | 74 |
| 3RD AVE | 72 |
| 9TH ST | 70 |
| 2ND AVE | 66 |
| 2ND ST | 62 |
| GOLDEN ISLES DR | 58 |
| 1ST ST | 52 |
| 5TH ST | 46 |
| 4TH AVE | 44 |
| 6TH ST | 42 |
| 11TH AVE | 38 |
| 1ST AVE | 36 |
| FOSTER RD | 36 |
| DIPLOMAT PKY | 34 |
| PEMBROKE RD | 34 |
| 1ST CT | 32 |
| LESLIE DR | 32 |
| 14TH AVE | 30 |
| 9TH AVE | 30 |
2005 - 2018 National Fire Incident Reporting System (NFIRS) incidents
- Incident types reported to NFIRS in Hallandale, FL
- 22,54264.4%Rescue & EMS
- 3,98911.4%Good Intent Call
- 2,8788.2%Service Call
- 2,4306.9%False Alarm
- 1,6184.6%Hazardous Condition
- 1,5544.4%Fire
- Fire incident types reported to NFIRS in Hallandale, FL
- 94060.5%Structure Fires
- 34021.9%Outside Fires
- 21513.8%Mobile Property/Vehicle Fires
- 593.8%Other
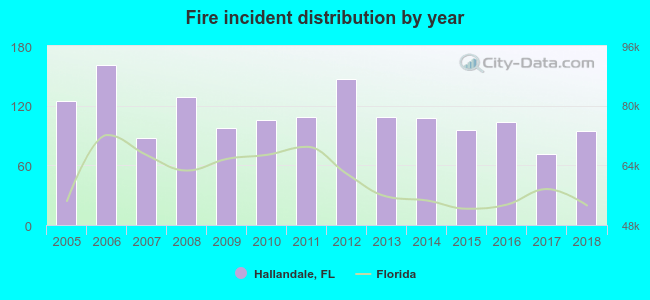 Based on the data from the years 2005 - 2018 the average number of fires per year is 110. The highest number of fires - 161 took place in 2006, and the least - 71 in 2017. The data has a dropping trend.
The average number of yearly fire incidents per 10k residents in Hallandale, FL compared to nearest cities:
(Note: Based on data for the last 3 years, including only cities with population 5,000 and above)
| Hallandale: | 24.5 |
| Hallandale Beach: | 0.3 |
| Aventura: | 9.7 |
| Pembroke Park: | 42.9 |
| Hollywood: | 20.1 |
| West Park: | 27.7 |
| Sunny Isles Beach: | 12.6 |
| North Miami Beach: | 12.4 |
| Dania Beach: | 0.5 |
 The median response time based on all reported fire incidents is 5 minutes. This is lower compared to the Florida median value.
The median response time in Hallandale, FL compared to nearest cities:
(Note: Based on data for all years, including only cities with at least 500 fire incidents)
| Hallandale: | 5 minutes |
| Hollywood: | 6 minutes |
| West Park: | 5 minutes |
| Miami Gardens: | 6 minutes |
| North Miami Beach: | 6 minutes |
| North Miami: | 6 minutes |
| Miramar: | 6 minutes |
| Cooper City: | 6 minutes |
| Fort Lauderdale: | 5 minutes |
 Based on the data from the years 2005 - 2018 the average number of fire-related yearly casualties is 1. The highest number of reported injuries - 7 took place in 2005, and the lowest - 0 in 2008. The data has a dropping trend.
The average number of injuries per 1,000 fire incidents is 11. This indicator was the highest - 56 in 2005, and the lowest 0 in 2008. The trend for casualties per 1,000 incidents is declining. Compared to the Florida value the number of injuries per 1,000 fire incidents is about the same.
Based on the data from the years 2005 - 2018 the average number of fire-related yearly casualties is 1. The highest number of reported injuries - 7 took place in 2005, and the lowest - 0 in 2008. The data has a dropping trend.
The average number of injuries per 1,000 fire incidents is 11. This indicator was the highest - 56 in 2005, and the lowest 0 in 2008. The trend for casualties per 1,000 incidents is declining. Compared to the Florida value the number of injuries per 1,000 fire incidents is about the same.Casualties per 1,000 incidents in Hallandale, FL compared to nearest cities:
(Note: Based on data for all years, including only cities with at least 500 fire incidents)
| Hallandale: | 12.9 |
| Hollywood: | 17.4 |
| West Park: | 18.9 |
| Miami Gardens: | 0.0 |
| North Miami Beach: | 0.0 |
| North Miami: | 0.0 |
| Miramar: | 17.8 |
| Cooper City: | 28.6 |
| Fort Lauderdale: | 9.8 |
 28.8% incidents where reported in the morning and 71.2% in the evening. The most fires (16.2%) took place on Saturday, and the least (12.7%) on Tuesday.
 According to the 1,554 fires from years 2005 - 2018 most fires (12.2%) took place during March, and the least (6.2%) in August.
 Out of all 35,027 cases reported during the years 2005 - 2018, the most belonged to the categories: Rescue & EMS (64.4%), Good Intent Call (11.4%), and Service Call (8.2%).
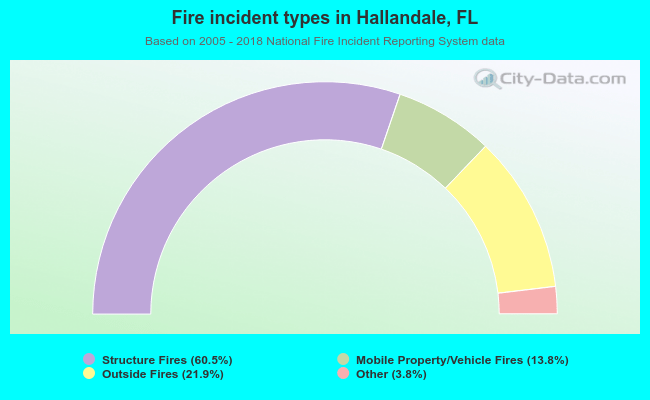 When looking into fire subcategories, the most reports belonged to: Structure Fires (60.5%), and Outside Fires (21.9%).