North Miami Beach: Fire Incidents, Florida (FL)
Where are fire incidents reported in North Miami Beach, FL
Something went wrong! Please refresh the page.
| Fire incidents reported | |
|---|---|
| Sreet name | Count |
| 163RD ST | 48 |
| 167TH ST | 48 |
| 170TH ST | 38 |
| DIXIE HWY | 36 |
| BISCAYNE BLVD | 32 |
| 168TH ST | 30 |
| 163 ST | 28 |
| 169 ST | 26 |
| 167 ST | 22 |
| 172ND ST | 22 |
| 169TH ST | 18 |
| 154TH ST | 16 |
| 164 ST | 16 |
| 171ST ST | 16 |
| 19 AVE | 16 |
| 170 ST | 14 |
| 181ST ST | 14 |
| 157TH TER | 12 |
| 164TH ST | 12 |
| 166TH ST | 12 |
| 168 ST | 12 |
| MIAMI BEACH BLVD | 12 |
| 173 ST | 10 |
| 173RD ST | 10 |
| 180 ST | 10 |
| GLADES DR | 10 |
| 136TH TER | 8 |
| 152ND ST | 8 |
| 174TH ST | 8 |
| 175TH ST | 8 |
| Other | 186 |
2008 - 2018 National Fire Incident Reporting System (NFIRS) incidents
- Incident types reported to NFIRS in North Miami Beach, FL
- 17,93076.4%Rescue & EMS
- 1,4966.4%False Alarm
- 1,4096.0%Good Intent Call
- 1,0554.5%Service Call
- 8163.5%Hazardous Condition
- 7583.2%Fire
- Fire incident types reported to NFIRS in North Miami Beach, FL
- 27336.0%Structure Fires
- 25834.0%Outside Fires
- 20527.0%Mobile Property/Vehicle Fires
- 222.9%Other
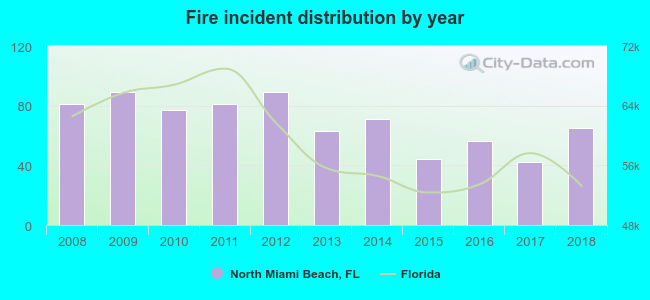 Based on the data from the years 2008 - 2018 the average number of fire incidents per year is 69. The highest number of fires - 89 took place in 2009, and the least - 42 in 2017. The data has a decreasing trend.
The average number of yearly fire incidents per 10k residents in North Miami Beach, FL compared to nearest cities:
(Note: Based on data for the last 3 years, including only cities with population 5,000 and above)
| North Miami Beach: | 12.4 |
| North Miami: | 18.8 |
| Sunny Isles Beach: | 12.6 |
| Aventura: | 9.7 |
| Bay Harbor Islands: | 5.0 |
| Hallandale Beach: | 0.3 |
| Pembroke Park: | 42.9 |
| West Park: | 27.7 |
| Hallandale: | 24.5 |
 The median response time based on all reported fire incidents is 6 minutes. This is about the same as the Florida median value.
The median response time in North Miami Beach, FL compared to nearest cities:
(Note: Based on data for all years, including only cities with at least 500 fire incidents)
| North Miami Beach: | 6 minutes |
| North Miami: | 6 minutes |
| Miami Gardens: | 6 minutes |
| West Park: | 5 minutes |
| Hallandale: | 5 minutes |
| Hollywood: | 6 minutes |
| Miramar: | 6 minutes |
| Hialeah: | 7 minutes |
| Miami: | 5 minutes |
 31.3% incidents where reported in the morning and 68.7% in the evening. The most fires (16.2%) took place on Friday, and the least (13.2%) on Tuesday.
 Based on the 758 incident reports from years 2008 - 2018 most fires (10.8%) took place during April, and the least (6.1%) in August.
 Out of all 23,472 cases reported during the years 2008 - 2018, the most belonged to the categories: Rescue & EMS (76.4%), False Alarm (6.4%), and Good Intent Call (6.0%).
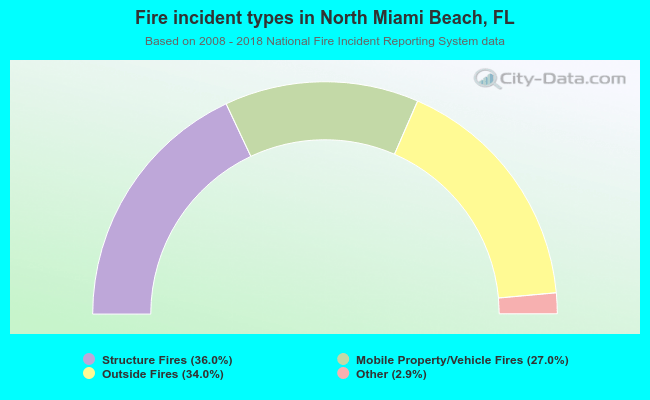 When looking into fire subcategories, the most incidents belonged to: Structure Fires (36.0%), and Outside Fires (34.0%).