Hallandale Beach: Fire Incidents, Florida (FL)
Where are fire incidents reported in Hallandale Beach, FL
Something went wrong! Please refresh the page.
|
| |||||||||||||||||||||||||||||||||||||||||||||||||||||||||||||||||||||||||||||||||||||||||||||||||||||||||||||
2002 - 2011 National Fire Incident Reporting System (NFIRS) incidents
- Incident types reported to NFIRS in Hallandale Beach, FL
- 11,72281.8%Rescue & EMS
- 7655.3%False Alarm
- 6294.4%Service Call
- 4583.2%Hazardous Condition
- 4042.8%Fire
- 2972.1%Good Intent Call
- 310.2%Overpressure Rupture
- 170.1%Special Incident
- Fire incident types reported to NFIRS in Hallandale Beach, FL
- 19047.0%Structure Fires
- 9824.3%Mobile Property/Vehicle Fires
- 8521.0%Outside Fires
- 317.7%Other
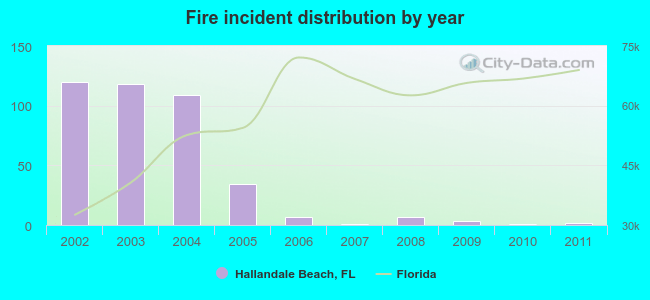 Based on the data from the years 2002 - 2011 the average number of fires per year is 40. The highest number of fires - 120 took place in 2002, and the least - 1 in 2007. The data has a dropping trend.
The average number of yearly fire incidents per 10k residents in Hallandale Beach, FL compared to nearest cities:
(Note: Based on data for the last 3 years, including only cities with population 5,000 and above)
| Hallandale Beach: | 0.3 |
| Hallandale: | 24.5 |
| Aventura: | 9.7 |
| Pembroke Park: | 42.9 |
| Sunny Isles Beach: | 12.6 |
| West Park: | 27.7 |
| Hollywood: | 20.1 |
| North Miami Beach: | 12.4 |
| Dania Beach: | 0.5 |

 Based on the reports from the years 2002 - 2011 the average number of fire-related casualties per year is 1. The highest number of reported casualties - 8 took place in 2003, and the lowest - 0 in 2002. The data has a constant trend.
 32.7% incidents where reported in the morning and 67.3% in the evening. The most fires (15.1%) took place on Monday, and the least (12.6%) on Saturday.
 According to the 404 fire incident reports from years 2002 - 2011 most fires (12.1%) took place during February, and the least (5.9%) in August.
 Out of all 14,330 cases reported during the years 2002 - 2011, the most belonged to the categories: Rescue & EMS (81.8%), False Alarm (5.3%), and Service Call (4.4%).
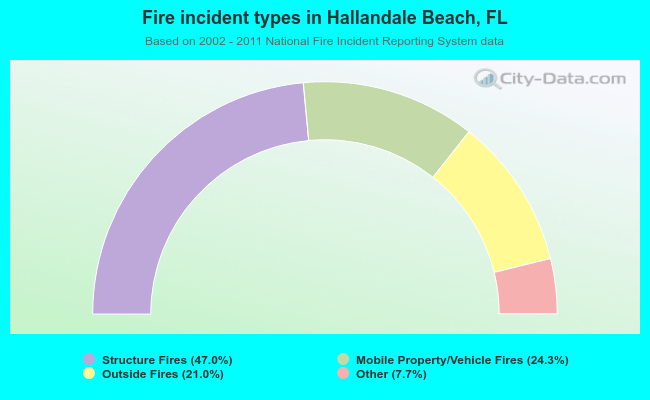 When looking into fire subcategories, the most incidents belonged to: Structure Fires (47.0%), and Mobile Property/Vehicle Fires (24.3%).