| Fire incidents reported |
|---|
| Sreet name | Count |
|---|
| SAYBROOK ROAD, HA | 34 | | PLAINS ROAD | 30 | | SAYBROOK RD | 18 | | CANDLEWOOD HILL RD | 16 | | BEAVER MEADOW ROAD HAD | 14 | | TURKEY HILL ROAD | 14 | | CAMP BETHEL ROAD | 12 | | SAYBROOK ROAD HWY | 12 | | WALKELY HILL RD | 12 | | CEDAR LAKE ROAD | 10 | | SAYBROOK ROAD HA | 10 | | BRIDGE STREET | 8 | | FILLEY ROAD | 8 | | ROUTE 9 EXIT 87 | 8 | | BEAVER MEADOW ROAD | 6 | | BRIDGE ROAD | 6 | | CEDAR LAKE RD | 6 | | FOOT HILLS RD | 6 | | FOREST RIDGE RD | 6 | | HADDAM MEADOWS STATE PARK | 6 | | HAYDEN HILL ROAD | 6 | | INDIAN HILL RD | 6 | | JAIL HILL RD | 6 | | KILLINGWORTH RD | 6 | | OLD TURNPIKE RD | 6 |
| | | Fire incidents reported |
|---|
| Sreet name | Count |
|---|
| OUT OF DISTRICT | 6 | | PARMELEE ROAD | 6 | | QUARRY HILL ROAD | 6 | | ROUTE 154 HWY | 6 | | ROUTE 9 S EXIT 87 HWY | 6 | | ROUTE 9 EXITS 7 & 8 | 6 | | ROUTE 9 NB EXIT 8 & 9 | 6 | | 82 CONNECTOR | 4 | | CANDLEWOOD HILL ROAD | 4 | | CHURCH HILL ROAD | 4 | | COUNTRY WALK | 4 | | EXITS 8 & 9 | 4 | | FOREST RIDGE | 4 | | OAK HILL TERRACE | 4 | | OLD CHESTER ROAD | 4 | | OLD PONSETT ROAD | 4 | | OLD TURNPIKE ROAD | 4 | | PLAINS RD | 4 | | ROUTE 81 HWY | 4 | | ROUTE 9 S EXIT 98 HWY | 4 | | ROUTE 9 N EXIT 89 HWY | 4 | | RUSSELL ROAD RD | 4 | | WEISE ALBERT RD | 4 | | 120 OLD TURNPIKE RD | 2 | | |
|
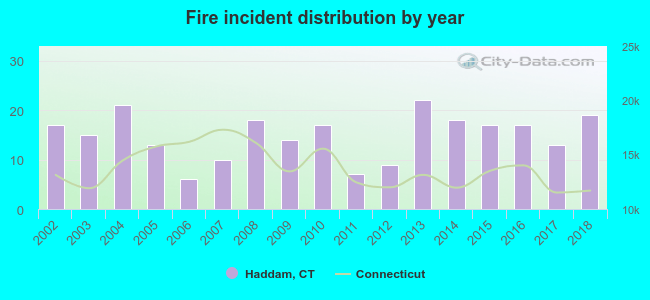 According to the data from the years 2002 - 2018 the average number of fires per year is 15. The highest number of fire incidents - 22 took place in 2013, and the least - 6 in 2006. The data has an increasing trend.
 30.4% incidents where reported in the morning and 69.6% in the evening. The most fires (17.4%) took place on Friday, and the least (9.1%) on Wednesday.
 Based on the 253 fire incident reports from years 2002 - 2018 most fires (13.4%) took place during July, and the least (4.7%) in September.
 Out of all 1,654 cases reported during the years 2002 - 2018, the most belonged to the categories: Rescue & EMS (54.8%), Hazardous Condition (15.4%), and Fire (15.3%).
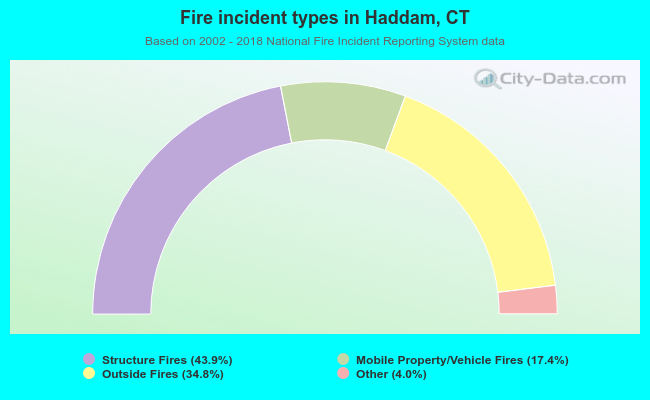 When looking into fire subcategories, the most reports belonged to: Structure Fires (43.9%), and Outside Fires (34.8%).