Killingworth: Fire Incidents, Connecticut (CT)
Where are fire incidents reported in Killingworth, CT
Something went wrong! Please refresh the page.
|
| |||||||||||||||||||||||||||||||||||||||||||||||||||||||||||||||||||||||||||||||||||||||||||||||||||||||||||||
2002 - 2018 National Fire Incident Reporting System (NFIRS) incidents
- Incident types reported to NFIRS in Killingworth, CT
- 1,12146.3%Rescue & EMS
- 40616.8%Fire
- 36915.2%Hazardous Condition
- 24310.0%False Alarm
- 1646.8%Service Call
- 1054.3%Good Intent Call
- 90.4%Severe Weather
- 30.1%Special Incident
- Fire incident types reported to NFIRS in Killingworth, CT
- 28971.2%Structure Fires
- 7318.0%Outside Fires
- 317.6%Mobile Property/Vehicle Fires
- 133.2%Other
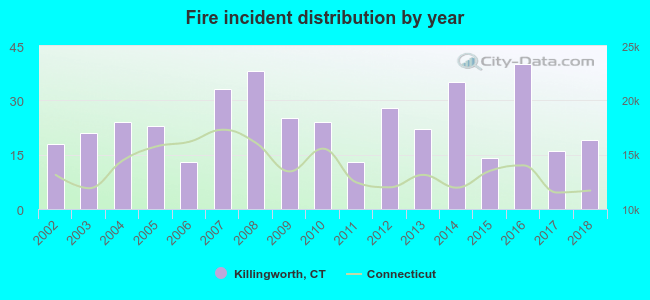 Based on the data from the years 2002 - 2018 the average number of fire incidents per year is 24. The highest number of reported fire incidents - 40 took place in 2016, and the least - 13 in 2006. The data has a growing trend.
The average number of yearly fire incidents per 10k residents in Killingworth, CT compared to nearest cities:
(Note: Based on data for the last 3 years, including only cities with population 5,000 and above)
| Killingworth: | 38.3 |
| Madison: | 37.0 |
| Haddam: | 19.6 |
| Guilford: | 59.3 |
| Essex: | 19.5 |
| Westbrook: | 32.7 |
| North Branford: | 19.0 |
| East Haddam: | 25.2 |
| Old Saybrook: | 66.7 |

 23.6% incidents where reported in the morning and 76.4% in the evening. The most fires (18.2%) took place on Sunday, and the least (11.3%) on Friday.
 According to the 406 incident reports from years 2002 - 2018 most fires (14.0%) took place during November, and the least (3.9%) in May.
 Out of all 2,422 cases reported during the years 2002 - 2018, the most belonged to the categories: Rescue & EMS (46.3%), Fire (16.8%), and Hazardous Condition (15.2%).
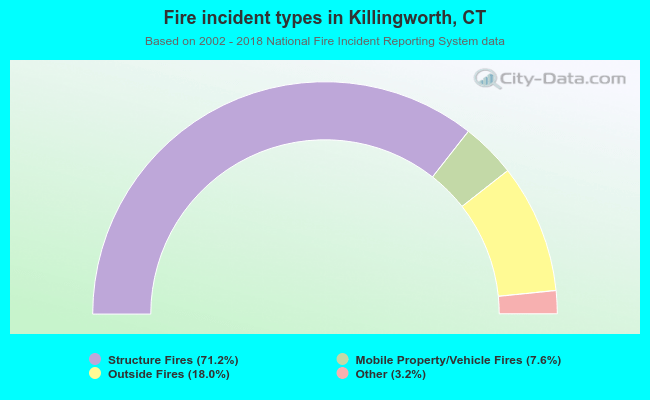 When looking into fire subcategories, the most incidents belonged to: Structure Fires (71.2%), and Outside Fires (18.0%).