Madison: Fire Incidents, Connecticut (CT)
Where are fire incidents reported in Madison, CT
Something went wrong! Please refresh the page.
| Fire incidents reported | |
|---|---|
| Sreet name | Count |
| BOSTON POST RD | 262 |
| DURHAM RD | 132 |
| HORSE POND RD | 56 |
| GREEN HILL RD | 46 |
| OPENING HILL RD | 46 |
| I-95 REST AREA | 36 |
| NECK RD | 34 |
| SUMMER HILL RD | 34 |
| BRADLEY RD | 32 |
| BRADLEY CORNERS RD | 30 |
| OLD TOLL RD | 26 |
| RACE HILL RD | 24 |
| WOODLAND RD | 24 |
| COPSE RD | 22 |
| I95 REST AREA | 20 |
| MIDDLE BEACH RD | 20 |
| WALL ST | 20 |
| NEW RD | 18 |
| WEST WHARF RD | 18 |
| BARTLETT DR | 16 |
| BUCK HILL RD | 16 |
| FORT PATH RD | 16 |
| HUNTERS TRL | 16 |
| RIDGE RD | 16 |
| 450 | 14 |
| HAMMONASSETT MEADOWS RD | 14 |
| MUNGERTOWN RD | 14 |
| PRINCESS DR | 14 |
| SILO HILL RD | 14 |
| COUNTY RD | 12 |
| Other | 35 |
2002 - 2018 National Fire Incident Reporting System (NFIRS) incidents
- Incident types reported to NFIRS in Madison, CT
- 2,20930.1%Rescue & EMS
- 1,84425.1%Hazardous Condition
- 1,23616.8%False Alarm
- 1,09714.9%Fire
- 6799.3%Good Intent Call
- 2483.4%Service Call
- 150.2%Severe Weather
- Fire incident types reported to NFIRS in Madison, CT
- 60455.1%Structure Fires
- 31028.3%Outside Fires
- 16615.1%Mobile Property/Vehicle Fires
- 171.5%Other
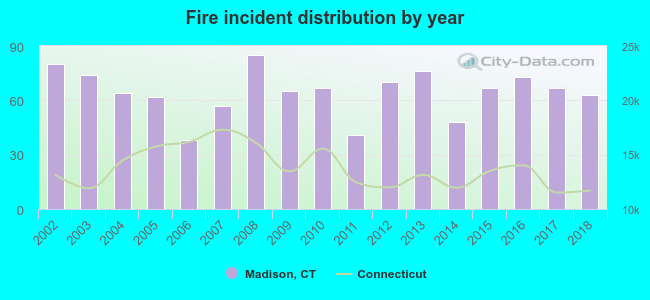 According to the data from the years 2002 - 2018 the average number of fires per year is 65. The highest number of reported fire incidents - 85 took place in 2008, and the least - 38 in 2006. The data has a dropping trend.
The average number of yearly fire incidents per 10k residents in Madison, CT compared to nearest cities:
(Note: Based on data for the last 3 years, including only cities with population 5,000 and above)
| Madison: | 37.0 |
| Guilford: | 59.3 |
| Killingworth: | 38.3 |
| Westbrook: | 32.7 |
| North Branford: | 19.0 |
| Branford: | 31.0 |
| Essex: | 19.5 |
| Old Saybrook: | 66.7 |
| Haddam: | 19.6 |
 The median response time based on all reported fire incidents is 6 minutes. This is comparable to the state median value.
The median response time in Madison, CT compared to nearest cities:
(Note: Based on data for all years, including only cities with at least 500 fire incidents)
| Madison: | 6 minutes |
| Clinton: | 6 minutes |
| Guilford: | 5 minutes |
| North Branford: | 6 minutes |
| Branford: | 5 minutes |
| Old Saybrook: | 4 minutes |
| East Haven: | 4 minutes |
| North Haven: | 6 minutes |
| Wallingford: | 6 minutes |
 According to the reports from the years 2002 - 2018 the average number of fire-related casualties per year is 1. The highest number of reported casualties - 4 took place in 2007, and the lowest - 0 in 2002. The data has a rising trend.
The average number of casualties per 1,000 fire incidents is 14. This indicator was the highest - 70 in 2007, and the lowest 0 in 2002. The trend for injuries per 1,000 incidents is rising. Compared to the state value the number of injuries per 1,000 fire incidents is similar.
According to the reports from the years 2002 - 2018 the average number of fire-related casualties per year is 1. The highest number of reported casualties - 4 took place in 2007, and the lowest - 0 in 2002. The data has a rising trend.
The average number of casualties per 1,000 fire incidents is 14. This indicator was the highest - 70 in 2007, and the lowest 0 in 2002. The trend for injuries per 1,000 incidents is rising. Compared to the state value the number of injuries per 1,000 fire incidents is similar.Casualties per 1,000 incidents in Madison, CT compared to nearest cities:
(Note: Based on data for all years, including only cities with at least 500 fire incidents)
| Madison: | 14.6 |
| Clinton: | 1.0 |
| Guilford: | 6.8 |
| North Branford: | 20.1 |
| Branford: | 18.7 |
| Old Saybrook: | 0.9 |
| East Haven: | 23.6 |
| North Haven: | 14.9 |
| Wallingford: | 14.4 |
 30.0% incidents where reported in the morning and 70.0% in the evening. The most fires (17.1%) took place on Saturday, and the least (12.0%) on Wednesday.
 Based on the 1,097 fire incidents from years 2002 - 2018 most fires (11.4%) took place during April, and the least (6.2%) in October.
 Out of all 7,338 cases reported during the years 2002 - 2018, the most belonged to the categories: Rescue & EMS (30.1%), Hazardous Condition (25.1%), and False Alarm (16.8%).
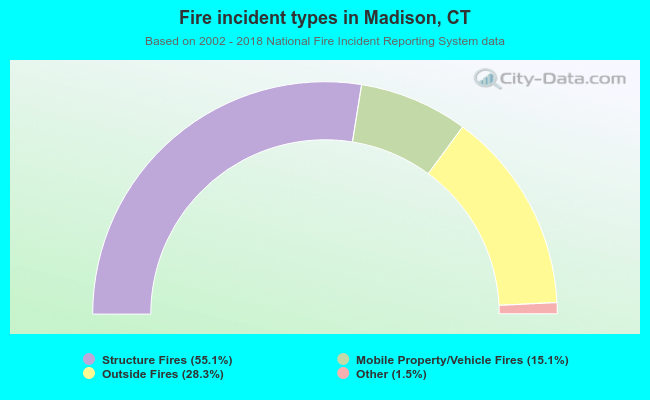 When looking into fire subcategories, the most reports belonged to: Structure Fires (55.1%), and Outside Fires (28.3%).