Colchester: Fire Incidents, Connecticut (CT)
Where are fire incidents reported in Colchester, CT
Something went wrong! Please refresh the page.
| Fire incidents reported | |
|---|---|
| Sreet name | Count |
| ROUTE 2 | 118 |
| WESTCHESTER RD | 92 |
| LEBANON AVE | 82 |
| NORWICH AVE | 66 |
| MIDDLETOWN RD | 56 |
| OLD HARTFORD RD | 52 |
| SOUTH MAIN ST | 50 |
| PARUM RD | 42 |
| LINWOOD AVE | 38 |
| NEW LONDON RD | 34 |
| CHESTNUT HILL RD | 32 |
| WEST RD | 28 |
| WINDHAM AVE | 26 |
| HALLS HILL RD | 24 |
| BROADWAY | 20 |
| BULL HILL RD | 20 |
| LAKE HAYWARD RD | 18 |
| OLD HEBRON RD | 18 |
| RIVER RD | 18 |
| CABIN RD | 16 |
| MAIN ST | 16 |
| STANAVAGE RD | 16 |
| WALL ST | 16 |
| AMSTON RD | 14 |
| BALABAN RD | 14 |
| BULKELEY HILL RD | 14 |
| LAKEVIEW DR | 14 |
| MILL HILL RD | 14 |
| PARK RD | 14 |
| PICKEREL LAKE RD | 14 |
| Other | 9 |
2002 - 2018 National Fire Incident Reporting System (NFIRS) incidents
- Incident types reported to NFIRS in Colchester, CT
- 5,32558.0%Rescue & EMS
- 1,12112.2%Hazardous Condition
- 1,00511.0%Fire
- 6997.6%Service Call
- 5586.1%False Alarm
- 4264.6%Good Intent Call
- 190.2%Severe Weather
- 130.1%Special Incident
- 100.1%Overpressure Rupture
- Fire incident types reported to NFIRS in Colchester, CT
- 39939.7%Structure Fires
- 33933.7%Outside Fires
- 16015.9%Mobile Property/Vehicle Fires
- 10710.6%Other
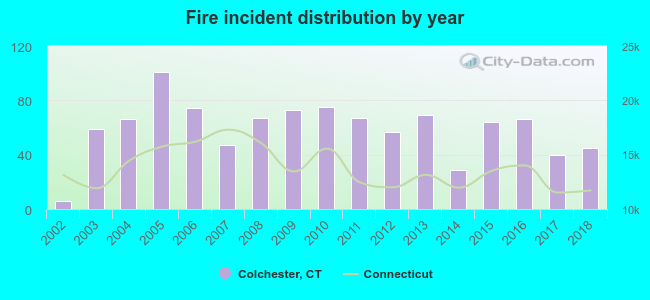 Based on the data from the years 2002 - 2018 the average number of fires per year is 59. The highest number of fires - 101 took place in 2005, and the least - 6 in 2002. The data has an increasing trend.
The average number of yearly fire incidents per 10k residents in Colchester, CT compared to nearest cities:
(Note: Based on data for the last 3 years, including only cities with population 5,000 and above)
| Colchester: | 31.3 |
| East Haddam: | 25.2 |
| Lebanon: | 32.8 |
| Hebron: | 17.2 |
| Marlborough: | 23.9 |
| Columbia: | 41.3 |
| Haddam: | 19.6 |
| Montville: | 19.2 |
| Willimantic: | 41.5 |
 The median response time based on all reported fire incidents is 8 minutes. This is higher than the Connecticut median value.
The median response time in Colchester, CT compared to nearest cities:
(Note: Based on data for all years, including only cities with at least 500 fire incidents)
| Colchester: | 8 minutes |
| East Haddam: | 11 minutes |
| Lebanon: | 12 minutes |
| East Hampton: | 6 minutes |
| Montville: | 7 minutes |
| Willimantic: | 4 minutes |
| Norwich: | 4 minutes |
| Portland: | 5 minutes |
| Coventry: | 7 minutes |
 Based on the data from the years 2002 - 2018 the average number of fire-related casualties per year is 1. The highest number of casualties - 4 took place in 2006, and the lowest - 0 in 2002. The data has a rising trend.
The average number of injuries per 1,000 fire incidents is 11. This indicator was the highest - 54 in 2006, and the lowest 0 in 2002. The trend for casualties per 1,000 incidents is rising. Compared to the state value the number of casualties per 1,000 fire incidents is about the same.
Based on the data from the years 2002 - 2018 the average number of fire-related casualties per year is 1. The highest number of casualties - 4 took place in 2006, and the lowest - 0 in 2002. The data has a rising trend.
The average number of injuries per 1,000 fire incidents is 11. This indicator was the highest - 54 in 2006, and the lowest 0 in 2002. The trend for casualties per 1,000 incidents is rising. Compared to the state value the number of casualties per 1,000 fire incidents is about the same.Casualties per 1,000 incidents in Colchester, CT compared to nearest cities:
(Note: Based on data for all years, including only cities with at least 500 fire incidents)
| Colchester: | 12.9 |
| East Haddam: | 0.0 |
| Lebanon: | 8.0 |
| East Hampton: | 4.3 |
| Montville: | 4.5 |
| Willimantic: | 23.8 |
| Norwich: | 7.6 |
| Portland: | 0.0 |
| Coventry: | 9.6 |
 29.2% incidents where reported in the morning and 70.8% in the evening. The most fires (18.7%) took place on Saturday, and the least (11.7%) on Monday.
 According to the 1,005 reports from years 2002 - 2018 most fires (13.7%) took place during April, and the least (4.8%) in September.
 Out of all 9,176 cases reported during the years 2002 - 2018, the most belonged to the categories: Rescue & EMS (58.0%), Hazardous Condition (12.2%), and Fire (11.0%).
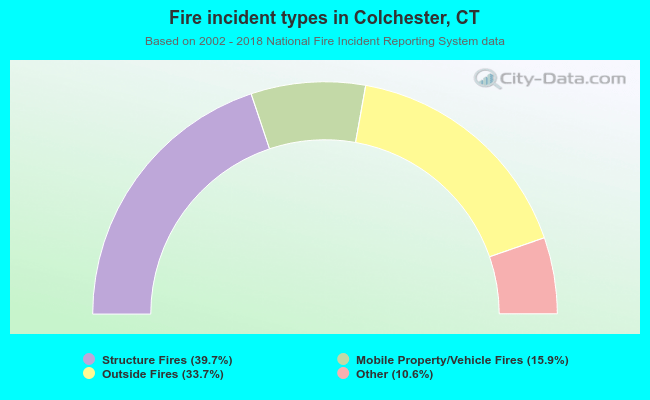 When looking into fire subcategories, the most reports belonged to: Structure Fires (39.7%), and Outside Fires (33.7%).