Faribault: Fire Incidents, Minnesota (MN)
Where are fire incidents reported in Faribault, MN
Something went wrong! Please refresh the page.
|
| |||||||||||||||||||||||||||||||||||||||||||||||||||||||||||||||||||||||||||||||||||||||||||||||||||||||||||||
2002 - 2018 National Fire Incident Reporting System (NFIRS) incidents
- Incident types reported to NFIRS in Faribault, MN
- 6,94858.5%Rescue & EMS
- 1,56513.2%Fire
- 1,1079.3%Good Intent Call
- 1,0869.2%Hazardous Condition
- 7806.6%False Alarm
- 3543.0%Service Call
- 170.1%Special Incident
- Fire incident types reported to NFIRS in Faribault, MN
- 57536.7%Structure Fires
- 55335.3%Outside Fires
- 30919.7%Mobile Property/Vehicle Fires
- 1288.2%Other
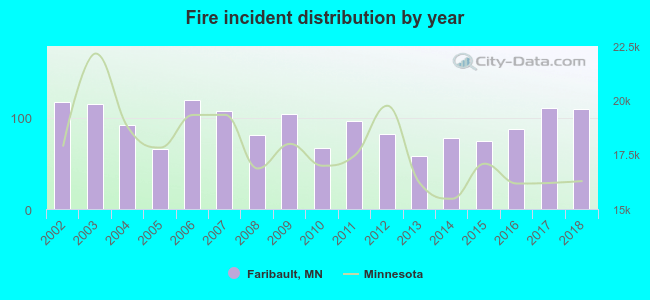 According to the data from the years 2002 - 2018 the average number of fires per year is 92. The highest number of fire incidents - 119 took place in 2006, and the least - 58 in 2013. The data has a dropping trend.
The average number of yearly fire incidents per 10k residents in Faribault, MN compared to nearest cities:
(Note: Based on data for the last 3 years, including only cities with population 5,000 and above)
| Faribault: | 43.5 |
| Northfield: | 30.0 |
| Owatonna: | 24.8 |
| Waseca: | 41.3 |
| New Prague: | 34.0 |
| Farmington: | 18.0 |
| Lakeville: | 13.6 |
| Prior Lake: | 22.2 |
| Jordan: | 35.7 |
 The median response time based on all reported fire incidents is 6 minutes. This is about the same as the Minnesota median value.
The median response time in Faribault, MN compared to nearest cities:
(Note: Based on data for all years, including only cities with at least 500 fire incidents)
| Faribault: | 6 minutes |
| Northfield: | 8 minutes |
| Owatonna: | 5 minutes |
| Waseca: | 6 minutes |
| Farmington: | 6 minutes |
| Lakeville: | 7 minutes |
| Prior Lake: | 4 minutes |
| Apple Valley: | 5 minutes |
| Burnsville: | 6 minutes |
 According to the reports from the years 2002 - 2018 the average number of fire-related yearly deaths is 0. The highest number of reported deaths - 2 took place in 2012, and the lowest - 0 in 2003. The data has a declining trend.
 29.5% incidents where reported in the morning and 70.5% in the evening. The most fires (15.1%) took place on Sunday, and the least (12.2%) on Wednesday.
 Based on the 1,565 fire incidents from years 2002 - 2018 most fires (12.5%) took place during April, and the least (5.5%) in February.
 Out of all 11,868 cases reported during the years 2002 - 2018, the most belonged to the categories: Rescue & EMS (58.5%), Fire (13.2%), and Good Intent Call (9.3%).
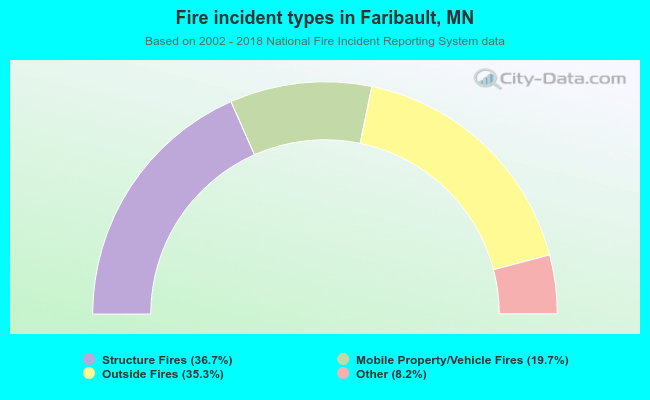 When looking into fire subcategories, the most incidents belonged to: Structure Fires (36.7%), and Outside Fires (35.3%).