Burnsville: Fire Incidents, Minnesota (MN)
Where are fire incidents reported in Burnsville, MN
Something went wrong! Please refresh the page.
| Fire incidents reported | |
|---|---|
| Sreet name | Count |
| BURNSVILLE PKY | 264 |
| PORTLAND AVE | 180 |
| CR 42 | 130 |
| CLIFF RD | 128 |
| NICOLLET AVE | 100 |
| 143 ST | 78 |
| HWY 13 | 74 |
| PARKWOOD DR | 72 |
| BURNSVILLE | 70 |
| RIVER HILLS DR | 66 |
| MCANDREWS RD | 62 |
| GREENHAVEN DR | 60 |
| HARRIET AVE | 58 |
| IRVING AVE | 58 |
| JUDICIAL RD | 58 |
| 13 HWY | 56 |
| CR 5 | 50 |
| BLACK DOG RD | 48 |
| HWY 13 HWY | 44 |
| 117 ST | 40 |
| BURNHAVEN DR | 40 |
| TRAVELERS TRL | 40 |
| PARK AVE | 38 |
| BUCK HILL RD | 34 |
| CRYSTAL LAKE RD | 34 |
| HWY I35W HWY | 34 |
| BURNSVILLE PKWY | 32 |
| GRAND AVE | 32 |
| UPTON AVE | 32 |
| CR 11 RD | 28 |
| Other | 473 |
2002 - 2018 National Fire Incident Reporting System (NFIRS) incidents
- Incident types reported to NFIRS in Burnsville, MN
- 20,80263.5%Rescue & EMS
- 3,1359.6%False Alarm
- 2,5137.7%Fire
- 2,1876.7%Good Intent Call
- 2,0096.1%Hazardous Condition
- 1,9195.9%Service Call
- 1020.3%Special Incident
- 710.2%Overpressure Rupture
- Fire incident types reported to NFIRS in Burnsville, MN
- 1,25950.1%Structure Fires
- 67126.7%Outside Fires
- 53421.2%Mobile Property/Vehicle Fires
- 491.9%Other
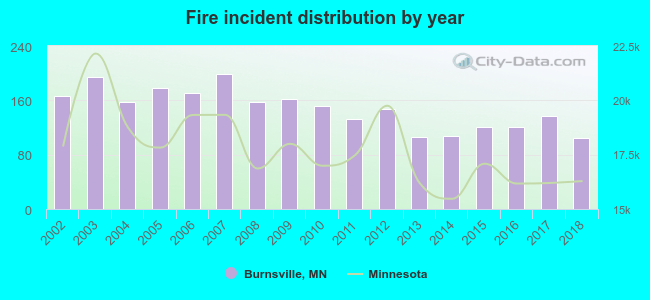 According to the data from the years 2002 - 2018 the average number of fire incidents per year is 148. The highest number of reported fires - 199 took place in 2007, and the least - 104 in 2018. The data has a decreasing trend.
The average number of yearly fire incidents per 10k residents in Burnsville, MN compared to nearest cities:
(Note: Based on data for the last 3 years, including only cities with population 5,000 and above)
| Burnsville: | 19.6 |
| Savage: | 9.7 |
| Apple Valley: | 16.2 |
| Lakeville: | 13.6 |
| Bloomington: | 21.2 |
| Eagan: | 12.1 |
| Prior Lake: | 22.2 |
| Rosemount: | 14.5 |
| Richfield: | 20.8 |
 The median response time based on all reported fire incidents is 6 minutes. This is similar to the Minnesota median value.
The median response time in Burnsville, MN compared to nearest cities:
(Note: Based on data for all years, including only cities with at least 500 fire incidents)
| Burnsville: | 6 minutes |
| Savage: | 5 minutes |
| Apple Valley: | 5 minutes |
| Lakeville: | 7 minutes |
| Bloomington: | 5 minutes |
| Eagan: | 6 minutes |
| Prior Lake: | 4 minutes |
| Richfield: | 4 minutes |
| Farmington: | 6 minutes |
 Based on the data from the years 2002 - 2018 the average number of fire-related yearly deaths is 0. The highest number of deaths - 2 took place in 2009, and the lowest - 0 in 2002. The data has a constant trend.
The average number of fatalities per 1,000 fires is 2. This indicator was the highest - 12 in 2009, and the lowest 0 in 2002. The trend for fatalities per 1,000 incidents is constant. Compared to the state value the number of fatalities per 1,000 fire incidents is lower.
Based on the data from the years 2002 - 2018 the average number of fire-related yearly deaths is 0. The highest number of deaths - 2 took place in 2009, and the lowest - 0 in 2002. The data has a constant trend.
The average number of fatalities per 1,000 fires is 2. This indicator was the highest - 12 in 2009, and the lowest 0 in 2002. The trend for fatalities per 1,000 incidents is constant. Compared to the state value the number of fatalities per 1,000 fire incidents is lower.Deaths per 1,000 incidents in Burnsville, MN compared to nearest cities:
(Note: Based on data for all years, including only cities with at least 2,500 fire incidents)
| Burnsville: | 2.0 |
| Bloomington: | 1.8 |
| Minneapolis: | 3.6 |
| Plymouth: | 0.3 |
 According to the data from the years 2002 - 2018 the average number of fire-related yearly casualties is 5. The highest number of injuries - 17 took place in 2003, and the lowest - 1 in 2004. The data has a decreasing trend.
The average number of injuries per 1,000 fire incidents is 32. This indicator was the highest - 88 in 2003, and the lowest 6 in 2004. The trend for injuries per 1,000 fires is decreasing. Compared to the state value the number of casualties per 1,000 fire incidents is much higher.
According to the data from the years 2002 - 2018 the average number of fire-related yearly casualties is 5. The highest number of injuries - 17 took place in 2003, and the lowest - 1 in 2004. The data has a decreasing trend.
The average number of injuries per 1,000 fire incidents is 32. This indicator was the highest - 88 in 2003, and the lowest 6 in 2004. The trend for injuries per 1,000 fires is decreasing. Compared to the state value the number of casualties per 1,000 fire incidents is much higher.Casualties per 1,000 incidents in Burnsville, MN compared to nearest cities:
(Note: Based on data for all years, including only cities with at least 500 fire incidents)
| Burnsville: | 33.4 |
| Savage: | 11.5 |
| Apple Valley: | 18.8 |
| Lakeville: | 10.2 |
| Bloomington: | 10.0 |
| Eagan: | 7.3 |
| Prior Lake: | 1.9 |
| Richfield: | 20.5 |
| Farmington: | 7.8 |
 33.5% incidents where reported in the morning and 66.5% in the evening. The most fires (14.9%) took place on Wednesday, and the least (13.8%) on Sunday.
 According to the 2,513 incident reports from years 2002 - 2018 most fires (12.0%) took place during July, and the least (4.8%) in February.
 Out of all 32,758 cases reported during the years 2002 - 2018, the most belonged to the categories: Rescue & EMS (63.5%), False Alarm (9.6%), and Fire (7.7%).
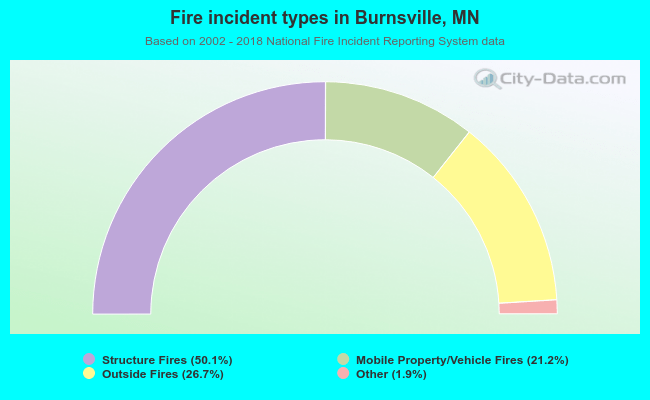 When looking into fire subcategories, the most reports belonged to: Structure Fires (50.1%), and Outside Fires (26.7%).