Eagan: Fire Incidents, Minnesota (MN)
Where are fire incidents reported in Eagan, MN
Something went wrong! Please refresh the page.
| Fire incidents reported | |
|---|---|
| Sreet name | Count |
| CLIFF RD | 88 |
| INTERSTATE 35E | 78 |
| PILOT KNOB RD | 72 |
| SLATER RD | 70 |
| DODD RD | 66 |
| DIFFLEY RD | 62 |
| TOWN CENTRE DR | 62 |
| SILVER BELL RD | 60 |
| COACHMAN RD | 54 |
| LEXINGTON AVE | 48 |
| NICOLS RD | 46 |
| BALLANTRAE RD | 42 |
| VALLEY VIEW DR | 42 |
| HWY 77 | 38 |
| RAHN RD | 38 |
| DENMARK AVE | 34 |
| CEDAR AVE | 30 |
| INTERSTATE 494 | 30 |
| NORTHVIEW PARK RD | 30 |
| BLACKHAWK RD | 28 |
| CLIFF LAKE RD | 28 |
| GOLFVIEW DR | 26 |
| I35E | 26 |
| LONE OAK RD | 26 |
| YANKEE DOODLE RD | 26 |
| HIGH SITE DR | 24 |
| CEDAR AV | 20 |
| FEDERAL DR | 20 |
| KENNEBEC DR | 20 |
| SIBLEY MEMORIAL HWY | 20 |
| Other | 538 |
2002 - 2018 National Fire Incident Reporting System (NFIRS) incidents
- Incident types reported to NFIRS in Eagan, MN
- 4,17635.5%Rescue & EMS
- 2,16918.4%False Alarm
- 1,79215.2%Fire
- 1,58913.5%Good Intent Call
- 1,39311.8%Hazardous Condition
- 5534.7%Service Call
- 500.4%Overpressure Rupture
- 280.2%Special Incident
- 170.1%Severe Weather
- Fire incident types reported to NFIRS in Eagan, MN
- 66937.3%Structure Fires
- 48827.2%Outside Fires
- 44224.7%Mobile Property/Vehicle Fires
- 19310.8%Other
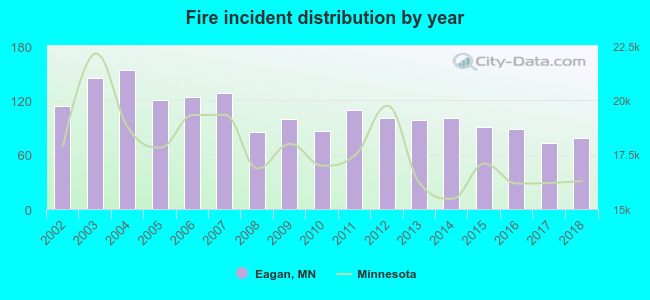 Based on the data from the years 2002 - 2018 the average number of fire incidents per year is 105. The highest number of fires - 153 took place in 2004, and the least - 73 in 2017. The data has a dropping trend.
The average number of yearly fire incidents per 10k residents in Eagan, MN compared to nearest cities:
(Note: Based on data for the last 3 years, including only cities with population 5,000 and above)
| Eagan: | 12.1 |
| Apple Valley: | 16.2 |
| Mendota Heights: | 15.1 |
| Rosemount: | 14.5 |
| Inver Grove Heights: | 20.9 |
| Burnsville: | 19.6 |
| Richfield: | 20.8 |
| Bloomington: | 21.2 |
| Lakeville: | 13.6 |
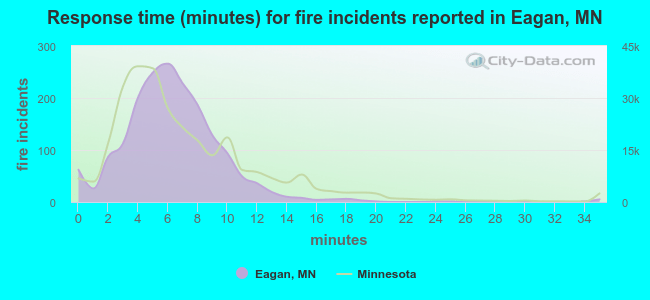 The median response time based on all reported fire incidents is 6 minutes. This is similar to the Minnesota median value.
The median response time in Eagan, MN compared to nearest cities:
(Note: Based on data for all years, including only cities with at least 500 fire incidents)
| Eagan: | 6 minutes |
| Apple Valley: | 5 minutes |
| Inver Grove Heights: | 7 minutes |
| Burnsville: | 6 minutes |
| Richfield: | 4 minutes |
| Bloomington: | 5 minutes |
| South St. Paul: | 3 minutes |
| Lakeville: | 7 minutes |
| Savage: | 5 minutes |
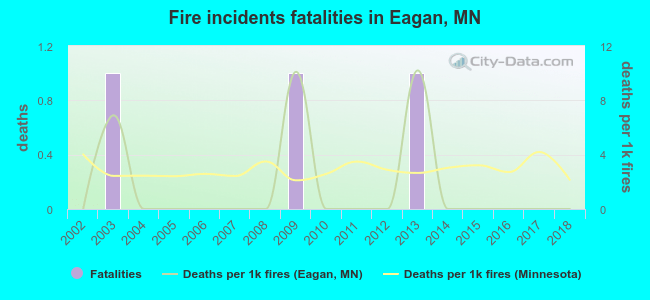 According to the reports from the years 2002 - 2018 the average number of fire-related yearly deaths is 0. The highest number of deaths - 1 took place in 2003, and the lowest - 0 in 2002. The data has a constant trend.
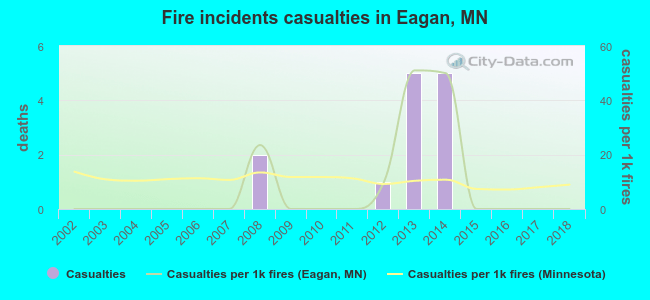 According to the reports from the years 2002 - 2018 the average number of fire-related yearly casualties is 1. The highest number of reported casualties - 5 took place in 2013, and the lowest - 0 in 2002. The data has a constant trend.
The average number of casualties per 1,000 fire incidents is 8. This indicator was the highest - 51 in 2013, and the lowest 0 in 2002. The trend for casualties per 1,000 fire incidents is constant. Compared to the state value the number of casualties per 1,000 incidents is lower.
According to the reports from the years 2002 - 2018 the average number of fire-related yearly casualties is 1. The highest number of reported casualties - 5 took place in 2013, and the lowest - 0 in 2002. The data has a constant trend.
The average number of casualties per 1,000 fire incidents is 8. This indicator was the highest - 51 in 2013, and the lowest 0 in 2002. The trend for casualties per 1,000 fire incidents is constant. Compared to the state value the number of casualties per 1,000 incidents is lower.Casualties per 1,000 incidents in Eagan, MN compared to nearest cities:
(Note: Based on data for all years, including only cities with at least 500 fire incidents)
| Eagan: | 7.3 |
| Apple Valley: | 18.8 |
| Inver Grove Heights: | 5.1 |
| Burnsville: | 33.4 |
| Richfield: | 20.5 |
| Bloomington: | 10.0 |
| South St. Paul: | 3.8 |
| Lakeville: | 10.2 |
| Savage: | 11.5 |
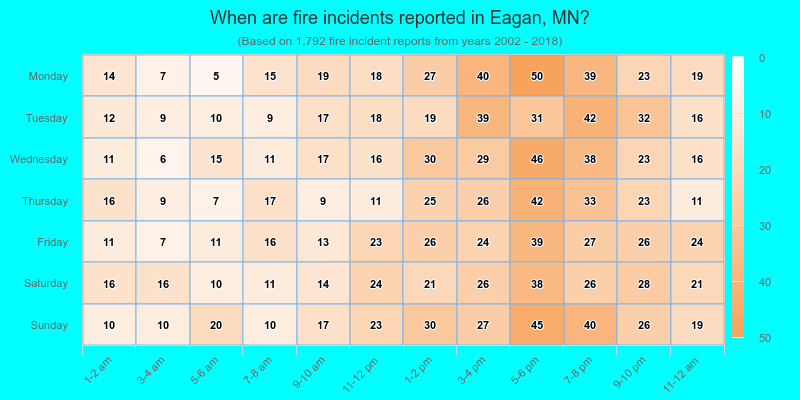
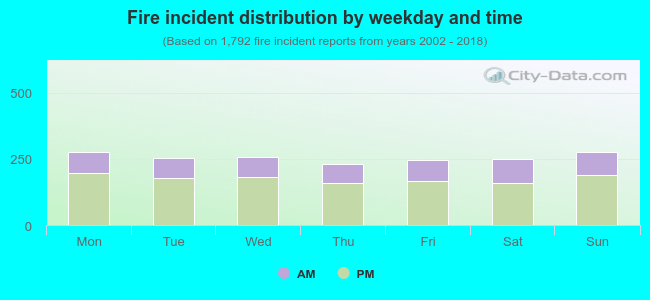 31.3% incidents where reported in the morning and 68.8% in the evening. The most fires (15.5%) took place on Sunday, and the least (12.8%) on Thursday.
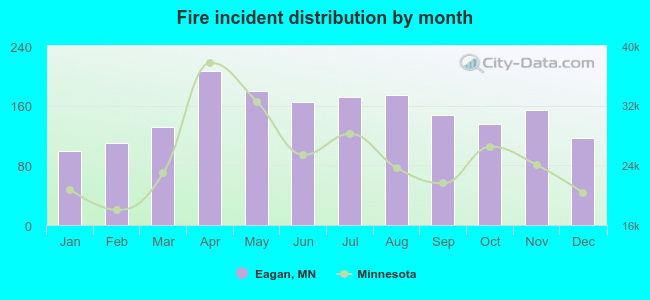 Based on the 1,792 fire incident reports from years 2002 - 2018 most fires (11.6%) took place during April, and the least (5.5%) in January.
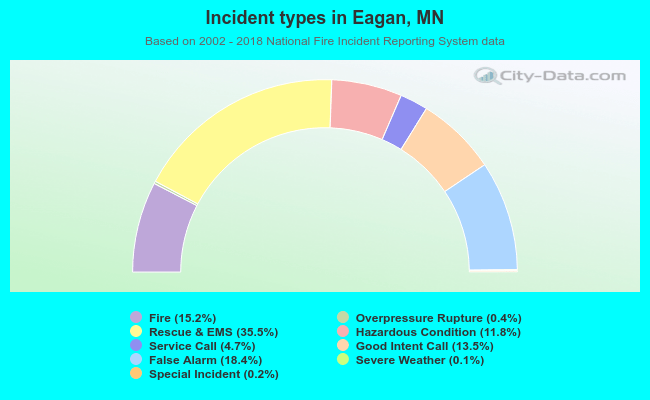 Out of all 11,767 cases reported during the years 2002 - 2018, the most belonged to the categories: Rescue & EMS (35.5%), False Alarm (18.4%), and Fire (15.2%).
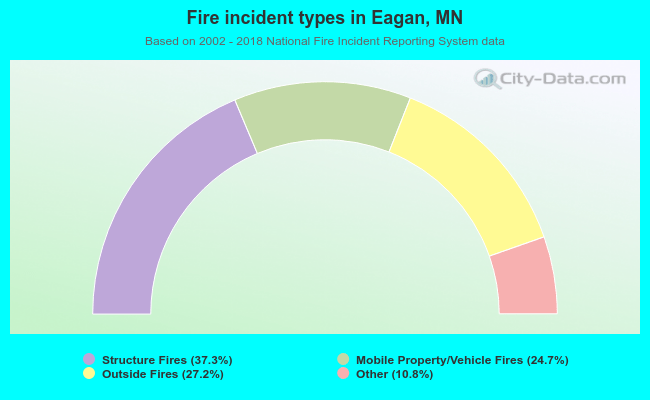 When looking into fire subcategories, the most incidents belonged to: Structure Fires (37.3%), and Outside Fires (27.2%).