Lakeville: Fire Incidents, Minnesota (MN)
Where are fire incidents reported in Lakeville, MN
Something went wrong! Please refresh the page.
| Fire incidents reported | |
|---|---|
| Sreet name | Count |
| KENRICK AVE | 74 |
| 210TH ST | 66 |
| DODD BLVD | 60 |
| KENWOOD TRL | 54 |
| KENYON AVE | 50 |
| 210 ST | 44 |
| 215 ST | 44 |
| INTERSTATE 35 | 32 |
| CEDAR AVE | 30 |
| HAMBURG AVE | 28 |
| 175TH ST | 26 |
| IBERIA AVE | 26 |
| 215TH ST | 24 |
| 160TH ST | 22 |
| HIGHVIEW AVE | 22 |
| IPAVA AVE | 22 |
| PILLSBURY AVE | 22 |
| 162ND ST | 20 |
| 250TH ST | 20 |
| 162 ST | 18 |
| IXONIA AVE | 18 |
| UPPER 167 ST | 18 |
| 175 ST | 16 |
| 185TH ST | 16 |
| 201 ST | 16 |
| JUNO TRL | 16 |
| OAK SHORE DR | 16 |
| 170 ST | 14 |
| 170TH ST | 14 |
| 185 ST | 14 |
| Other | 612 |
2002 - 2018 National Fire Incident Reporting System (NFIRS) incidents
- Incident types reported to NFIRS in Lakeville, MN
- 3,11634.7%Rescue & EMS
- 1,47416.4%Fire
- 1,43816.0%Hazardous Condition
- 1,36515.2%Good Intent Call
- 1,23413.8%False Alarm
- 2723.0%Service Call
- 370.4%Severe Weather
- 250.3%Overpressure Rupture
- Fire incident types reported to NFIRS in Lakeville, MN
- 67245.6%Structure Fires
- 44630.3%Outside Fires
- 32021.7%Mobile Property/Vehicle Fires
- 362.4%Other
 According to the data from the years 2002 - 2018 the average number of fire incidents per year is 87. The highest number of reported fires - 113 took place in 2003, and the least - 43 in 2013. The data has a dropping trend.
The average number of yearly fire incidents per 10k residents in Lakeville, MN compared to nearest cities:
(Note: Based on data for the last 3 years, including only cities with population 5,000 and above)
| Lakeville: | 13.6 |
| Apple Valley: | 16.2 |
| Burnsville: | 19.6 |
| Farmington: | 18.0 |
| Rosemount: | 14.5 |
| Savage: | 9.7 |
| Eagan: | 12.1 |
| Prior Lake: | 22.2 |
| Bloomington: | 21.2 |
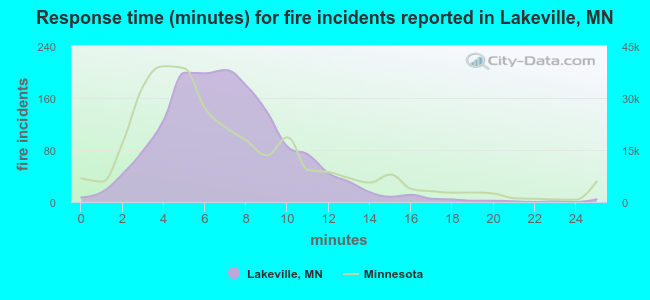 The median response time based on all reported fire incidents is 7 minutes. This is comparable to the state median value.
The median response time in Lakeville, MN compared to nearest cities:
(Note: Based on data for all years, including only cities with at least 500 fire incidents)
| Lakeville: | 7 minutes |
| Apple Valley: | 5 minutes |
| Burnsville: | 6 minutes |
| Farmington: | 6 minutes |
| Savage: | 5 minutes |
| Eagan: | 6 minutes |
| Prior Lake: | 4 minutes |
| Bloomington: | 5 minutes |
| Richfield: | 4 minutes |
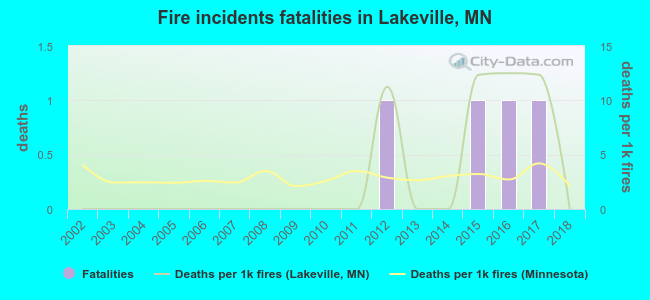 According to the data from the years 2002 - 2018 the average number of fire-related yearly deaths is 0. The highest number of deaths - 1 took place in 2012, and the lowest - 0 in 2002. The data has a constant trend.
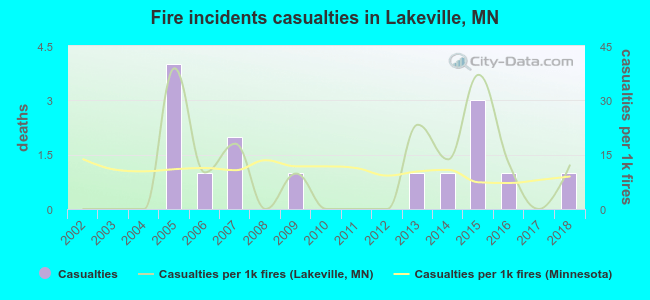 According to the data from the years 2002 - 2018 the average number of fire-related casualties per year is 1. The highest number of reported injuries - 4 took place in 2005, and the lowest - 0 in 2002. The data has a growing trend.
The average number of casualties per 1,000 fires is 10. This indicator was the highest - 39 in 2005, and the lowest 0 in 2002. The trend for casualties per 1,000 incidents is increasing. Compared to the state value the number of injuries per 1,000 incidents is similar.
According to the data from the years 2002 - 2018 the average number of fire-related casualties per year is 1. The highest number of reported injuries - 4 took place in 2005, and the lowest - 0 in 2002. The data has a growing trend.
The average number of casualties per 1,000 fires is 10. This indicator was the highest - 39 in 2005, and the lowest 0 in 2002. The trend for casualties per 1,000 incidents is increasing. Compared to the state value the number of injuries per 1,000 incidents is similar.Casualties per 1,000 incidents in Lakeville, MN compared to nearest cities:
(Note: Based on data for all years, including only cities with at least 500 fire incidents)
| Lakeville: | 10.2 |
| Apple Valley: | 18.8 |
| Burnsville: | 33.4 |
| Farmington: | 7.8 |
| Savage: | 11.5 |
| Eagan: | 7.3 |
| Prior Lake: | 1.9 |
| Bloomington: | 10.0 |
| Richfield: | 20.5 |
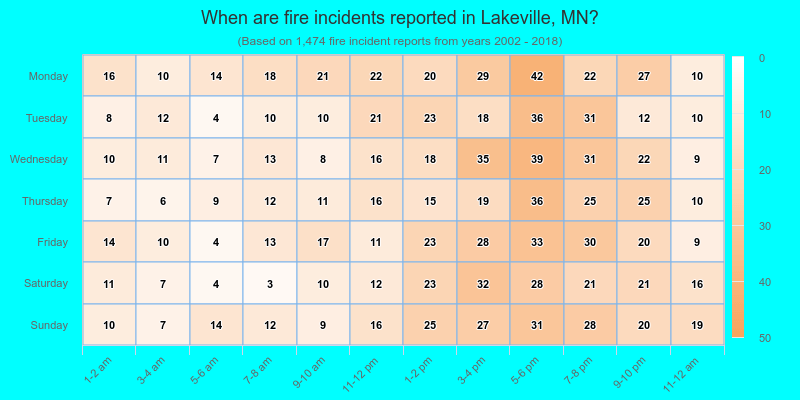
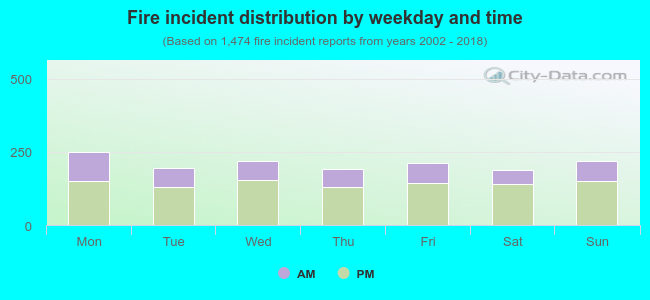 32.3% incidents where reported in the morning and 67.7% in the evening. The most fires (17.0%) took place on Monday, and the least (12.8%) on Saturday.
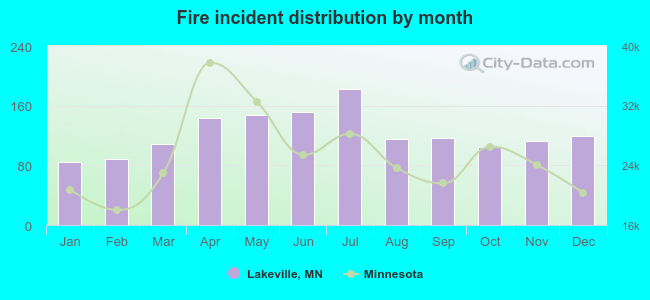 Based on the 1,474 reports from years 2002 - 2018 most fires (12.3%) took place during July, and the least (5.8%) in January.
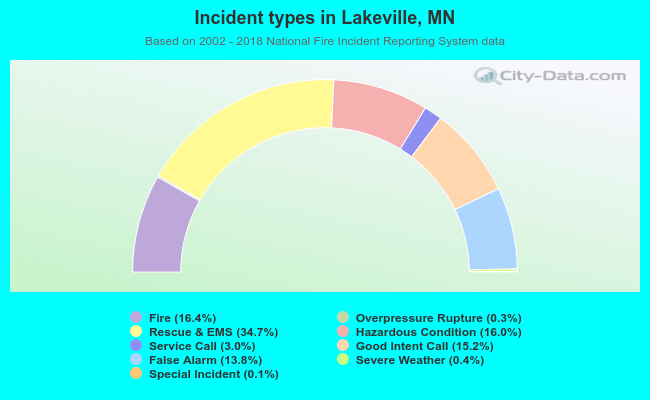 Out of all 8,967 cases reported during the years 2002 - 2018, the most belonged to the categories: Rescue & EMS (34.7%), Fire (16.4%), and Hazardous Condition (16.0%).
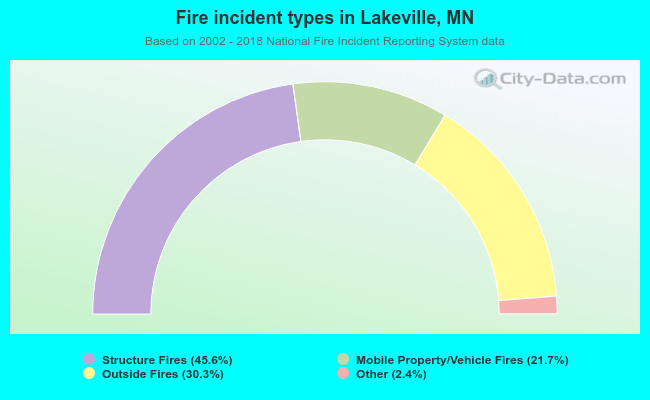 When looking into fire subcategories, the most reports belonged to: Structure Fires (45.6%), and Outside Fires (30.3%).