Richfield: Fire Incidents, Minnesota (MN)
Where are fire incidents reported in Richfield, MN
Something went wrong! Please refresh the page.
| Fire incidents reported | |
|---|---|
| Sreet name | Count |
| PENN AVE | 198 |
| LYNDALE AVE | 110 |
| NICOLLET AVE | 108 |
| PORTLAND AVE | 106 |
| 66TH ST | 98 |
| CEDAR AVE | 94 |
| 78TH ST | 92 |
| OUTOFAREA WAY | 70 |
| OLIVER AVE | 66 |
| PLEASANT AVE | 60 |
| 78 ST | 58 |
| RICHFIELD | 58 |
| KNOX AVE | 52 |
| HARRIET AVE | 48 |
| 18TH AVE | 44 |
| 66 ST | 44 |
| BLOOMINGTON AVE | 44 |
| DUPONT AVE | 40 |
| 77TH ST | 38 |
| LOGAN AVE | 38 |
| 12TH AVE | 36 |
| 4TH AVE | 36 |
| UPTON AVE | 36 |
| 11TH AVE | 30 |
| CHICAGO AVE | 30 |
| LAKE SHORE DR | 30 |
| SHERIDAN AVE | 30 |
| THOMAS AVE | 30 |
| 2ND AVE | 28 |
| ELLIOT AVE | 28 |
2002 - 2018 National Fire Incident Reporting System (NFIRS) incidents
- Incident types reported to NFIRS in Richfield, MN
- 15,45866.8%Rescue & EMS
- 2,2789.8%Service Call
- 1,7657.6%Hazardous Condition
- 1,6127.0%Fire
- 1,0134.4%False Alarm
- 9864.3%Good Intent Call
- 240.1%Overpressure Rupture
- Fire incident types reported to NFIRS in Richfield, MN
- 78648.8%Structure Fires
- 47429.4%Outside Fires
- 30318.8%Mobile Property/Vehicle Fires
- 493.0%Other
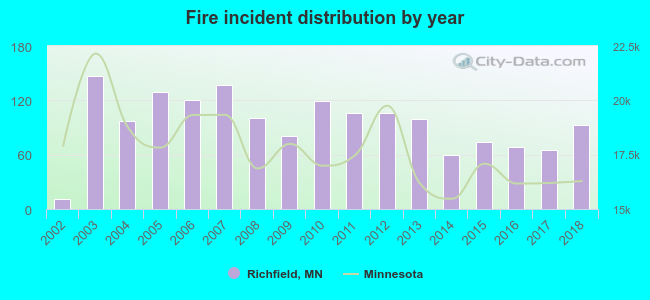 Based on the data from the years 2002 - 2018 the average number of fire incidents per year is 95. The highest number of reported fire incidents - 147 took place in 2003, and the least - 11 in 2002. The data has an increasing trend.
The average number of yearly fire incidents per 10k residents in Richfield, MN compared to nearest cities:
(Note: Based on data for the last 3 years, including only cities with population 5,000 and above)
| Richfield: | 20.8 |
| Bloomington: | 21.2 |
| Edina: | 18.1 |
| Minneapolis: | 24.5 |
| Hopkins: | 30.1 |
| Eagan: | 12.1 |
| Mendota Heights: | 15.1 |
| Burnsville: | 19.6 |
| Golden Valley: | 25.9 |
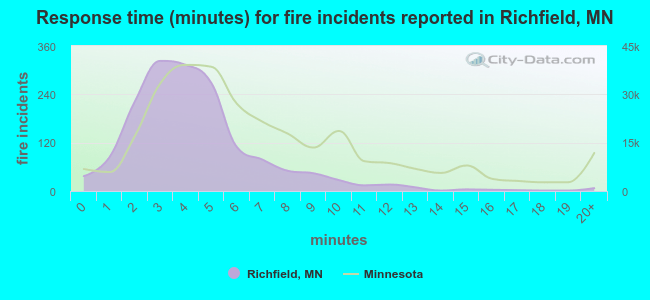 The median response time based on all reported fire incidents is 4 minutes. This is lower compared to the state median value.
The median response time in Richfield, MN compared to nearest cities:
(Note: Based on data for all years, including only cities with at least 500 fire incidents)
| Richfield: | 4 minutes |
| Bloomington: | 5 minutes |
| Edina: | 5 minutes |
| Minneapolis: | 4 minutes |
| St. Louis Park: | 5 minutes |
| Hopkins: | 5 minutes |
| Eagan: | 6 minutes |
| Burnsville: | 6 minutes |
| Golden Valley: | 7 minutes |
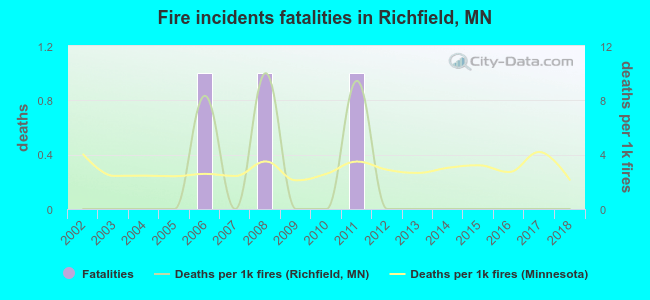 Based on the data from the years 2002 - 2018 the average number of fire-related fatalities per year is 0. The highest number of deaths - 1 took place in 2006, and the lowest - 0 in 2002. The data has a constant trend.
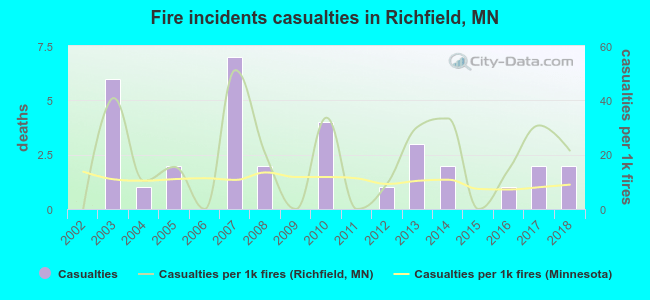 According to the data from the years 2002 - 2018 the average number of fire-related casualties per year is 2. The highest number of reported casualties - 7 took place in 2007, and the lowest - 0 in 2002. The data has an increasing trend.
The average number of injuries per 1,000 fires is 18. This indicator was the highest - 51 in 2007, and the lowest 0 in 2002. The trend for casualties per 1,000 incidents is growing. Compared to the Minnesota value the number of injuries per 1,000 fire incidents is higher.
According to the data from the years 2002 - 2018 the average number of fire-related casualties per year is 2. The highest number of reported casualties - 7 took place in 2007, and the lowest - 0 in 2002. The data has an increasing trend.
The average number of injuries per 1,000 fires is 18. This indicator was the highest - 51 in 2007, and the lowest 0 in 2002. The trend for casualties per 1,000 incidents is growing. Compared to the Minnesota value the number of injuries per 1,000 fire incidents is higher.Casualties per 1,000 incidents in Richfield, MN compared to nearest cities:
(Note: Based on data for all years, including only cities with at least 500 fire incidents)
| Richfield: | 20.5 |
| Bloomington: | 10.0 |
| Edina: | 40.5 |
| Minneapolis: | 17.0 |
| St. Louis Park: | 32.2 |
| Hopkins: | 17.8 |
| Eagan: | 7.3 |
| Burnsville: | 33.4 |
| Golden Valley: | 2.1 |
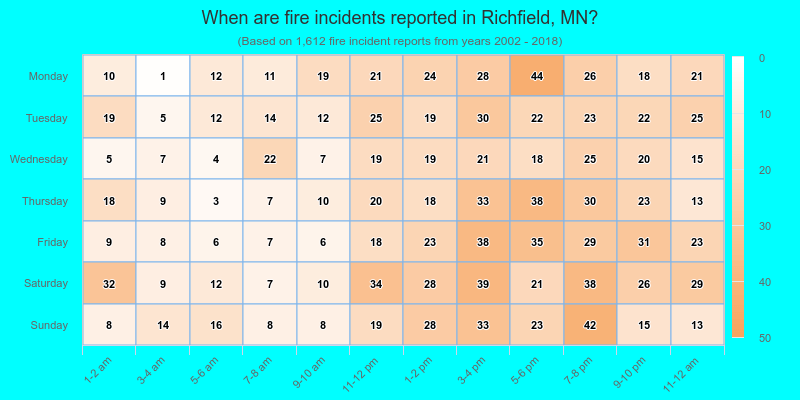
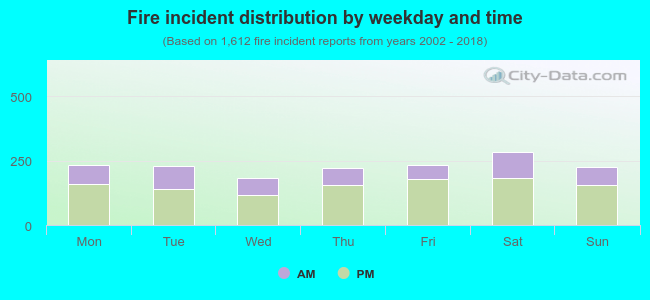 32.4% incidents where reported in the morning and 67.6% in the evening. The most fires (17.7%) took place on Saturday, and the least (11.3%) on Wednesday.
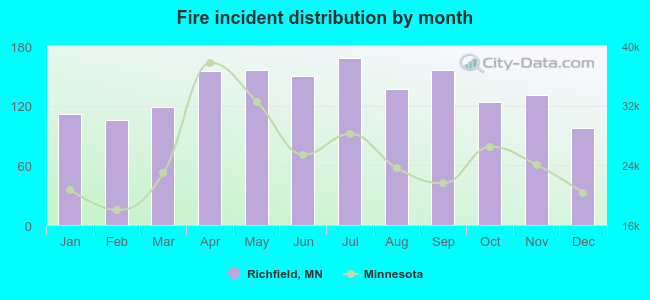 According to the 1,612 fire incidents from years 2002 - 2018 most fires (10.4%) took place during July, and the least (6.1%) in December.
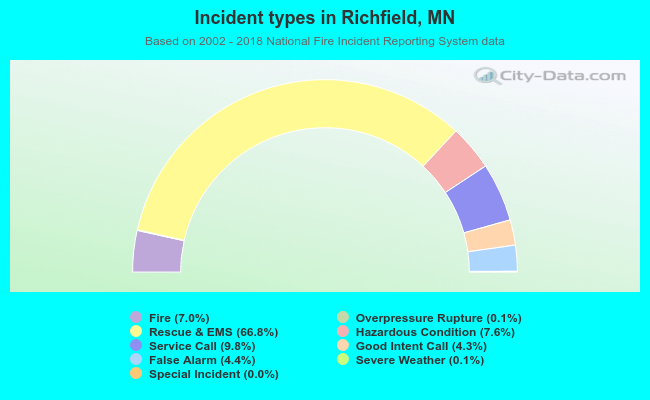 Out of all 23,156 cases reported during the years 2002 - 2018, the most belonged to the categories: Rescue & EMS (66.8%), Service Call (9.8%), and Hazardous Condition (7.6%).
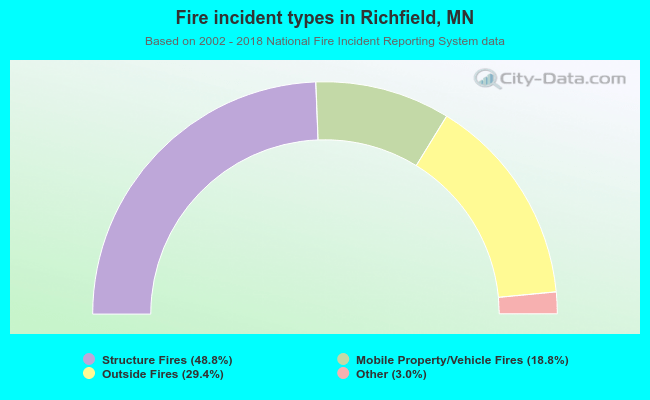 When looking into fire subcategories, the most reports belonged to: Structure Fires (48.8%), and Outside Fires (29.4%).