Waseca: Fire Incidents, Minnesota (MN)
Where are fire incidents reported in Waseca, MN
Something went wrong! Please refresh the page.
|
| |||||||||||||||||||||||||||||||||||||||||||||||||||||||||||||||||||||||||||||||||||||||||||||||||||||||||||||
2002 - 2018 National Fire Incident Reporting System (NFIRS) incidents
- Incident types reported to NFIRS in Waseca, MN
- 1,88051.6%Rescue & EMS
- 71319.6%Fire
- 53114.6%Hazardous Condition
- 1875.1%False Alarm
- 1574.3%Good Intent Call
- 1504.1%Service Call
- 140.4%Special Incident
- 90.2%Severe Weather
- Fire incident types reported to NFIRS in Waseca, MN
- 28640.1%Structure Fires
- 26737.4%Outside Fires
- 10014.0%Mobile Property/Vehicle Fires
- 608.4%Other
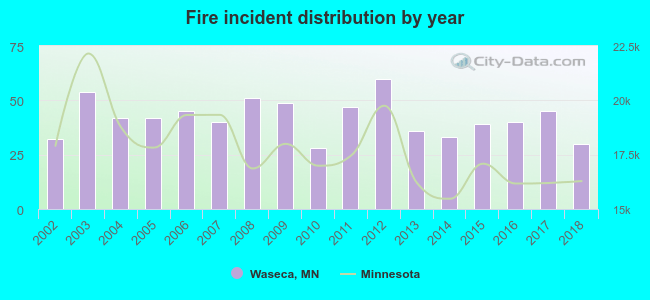 Based on the data from the years 2002 - 2018 the average number of fires per year is 42. The highest number of reported fires - 60 took place in 2012, and the least - 28 in 2010. The data has a declining trend.
The average number of yearly fire incidents per 10k residents in Waseca, MN compared to nearest cities:
(Note: Based on data for the last 3 years, including only cities with population 5,000 and above)
| Waseca: | 41.3 |
| Owatonna: | 24.8 |
| Faribault: | 43.5 |
| Mankato: | 32.2 |
| North Mankato: | 15.4 |
| Albert Lea: | 37.2 |
| Northfield: | 30.0 |
| New Prague: | 34.0 |
| Kasson: | 22.0 |
 The median response time based on all reported fire incidents is 6 minutes. This is comparable to the state median value.
The median response time in Waseca, MN compared to nearest cities:
(Note: Based on data for all years, including only cities with at least 500 fire incidents)
| Waseca: | 6 minutes |
| Owatonna: | 5 minutes |
| Faribault: | 6 minutes |
| Mankato: | 5 minutes |
| Albert Lea: | 4 minutes |
| Northfield: | 8 minutes |
| Austin: | 5 minutes |
 33.2% incidents where reported in the morning and 66.8% in the evening. The most fires (17.0%) took place on Saturday, and the least (12.8%) on Thursday.
 Based on the 713 fire incidents from years 2002 - 2018 most fires (13.6%) took place during April, and the least (5.3%) in February.
 Out of all 3,642 cases reported during the years 2002 - 2018, the most belonged to the categories: Rescue & EMS (51.6%), Fire (19.6%), and Hazardous Condition (14.6%).
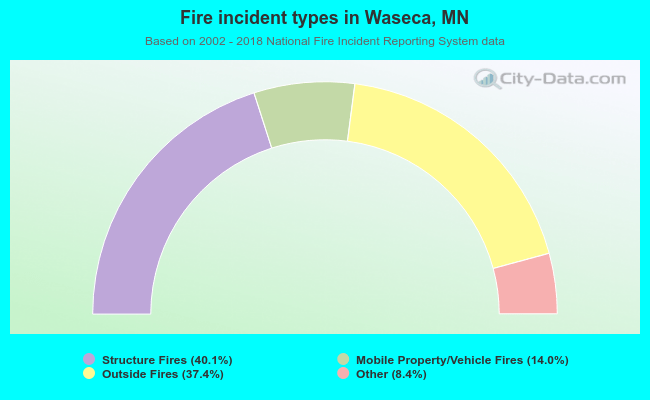 When looking into fire subcategories, the most incidents belonged to: Structure Fires (40.1%), and Outside Fires (37.4%).