Kasson: Fire Incidents, Minnesota (MN)
Where are fire incidents reported in Kasson, MN
Something went wrong! Please refresh the page.
|
| |||||||||||||||||||||||||||||||||||||||||||||||||||||||||||||||||||||||||||||||||||||||||||||||||||||||||||||
2004 - 2018 National Fire Incident Reporting System (NFIRS) incidents
- Incident types reported to NFIRS in Kasson, MN
- 1,00275.9%Rescue & EMS
- 16612.6%Fire
- 916.9%Hazardous Condition
- 362.7%Good Intent Call
- 120.9%False Alarm
- 60.5%Severe Weather
- 40.3%Overpressure Rupture
- 30.2%Service Call
- Fire incident types reported to NFIRS in Kasson, MN
- 7444.6%Structure Fires
- 5331.9%Outside Fires
- 3822.9%Mobile Property/Vehicle Fires
- 10.6%Other
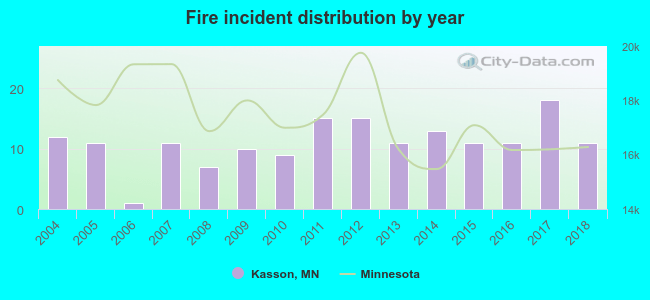 Based on the data from the years 2004 - 2018 the average number of fires per year is 11. The highest number of reported fires - 18 took place in 2017, and the least - 1 in 2006. The data has a decreasing trend.
The average number of yearly fire incidents per 10k residents in Kasson, MN compared to nearest cities:
(Note: Based on data for the last 3 years, including only cities with population 5,000 and above)
| Kasson: | 22.0 |
| Byron: | 25.0 |
| Rochester: | 15.9 |
| Stewartville: | 14.9 |
| Owatonna: | 24.8 |
| Austin: | 22.3 |
| Faribault: | 43.5 |
| Northfield: | 30.0 |
| Waseca: | 41.3 |
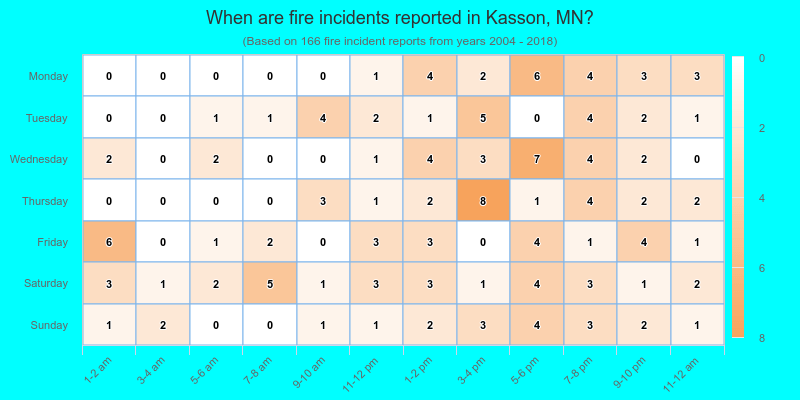
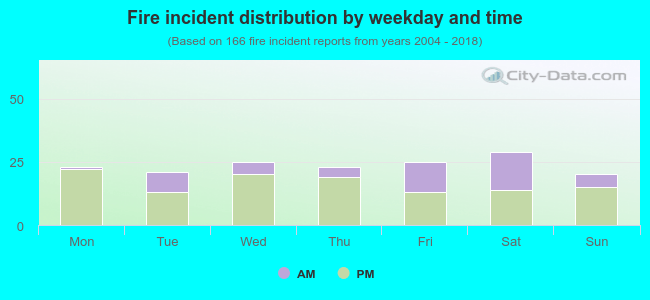 30.1% incidents where reported in the morning and 69.9% in the evening. The most fires (17.5%) took place on Saturday, and the least (12.0%) on Sunday.
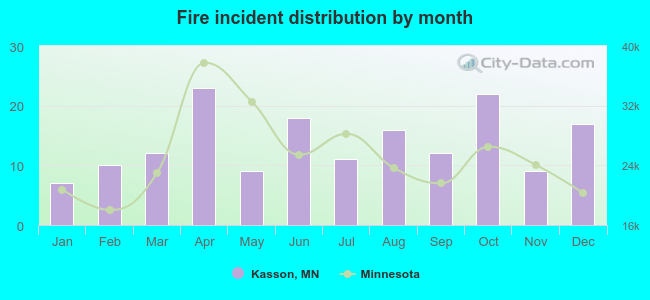 According to the 166 fire incident reports from years 2004 - 2018 most fires (13.9%) took place during April, and the least (4.2%) in January.
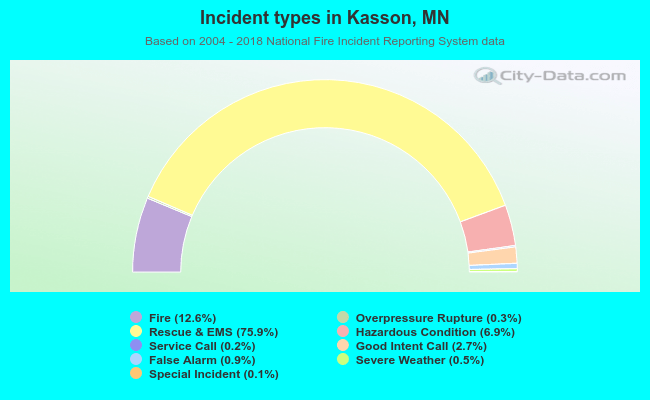 Out of all 1,321 cases reported during the years 2004 - 2018, the most belonged to the categories: Rescue & EMS (75.9%), Fire (12.6%), and Hazardous Condition (6.9%).
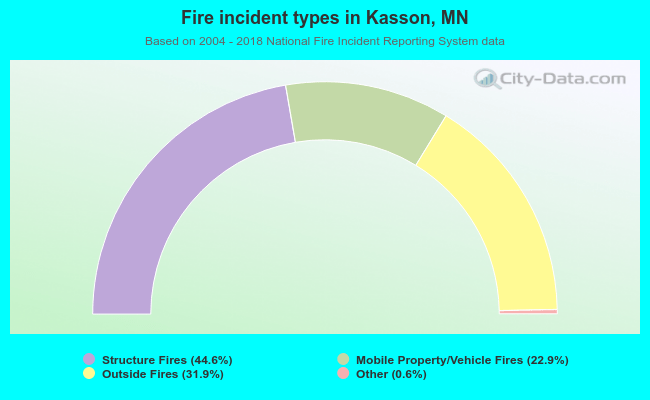 When looking into fire subcategories, the most incidents belonged to: Structure Fires (44.6%), and Outside Fires (31.9%).