New Prague: Fire Incidents, Minnesota (MN)
Where are fire incidents reported in New Prague, MN
Something went wrong! Please refresh the page.
|
| |||||||||||||||||||||||||||||||||||||||||||||||||||||||||||||||||||||||||||||||||||||||||||||||||||||||||||||
2002 - 2018 National Fire Incident Reporting System (NFIRS) incidents
- Incident types reported to NFIRS in New Prague, MN
- 47734.0%Fire
- 36325.8%Hazardous Condition
- 20014.2%False Alarm
- 15611.1%Good Intent Call
- 15010.7%Rescue & EMS
- 312.2%Service Call
- 251.8%Severe Weather
- 30.2%Special Incident
- Fire incident types reported to NFIRS in New Prague, MN
- 19440.7%Outside Fires
- 18037.7%Structure Fires
- 8317.4%Mobile Property/Vehicle Fires
- 204.2%Other
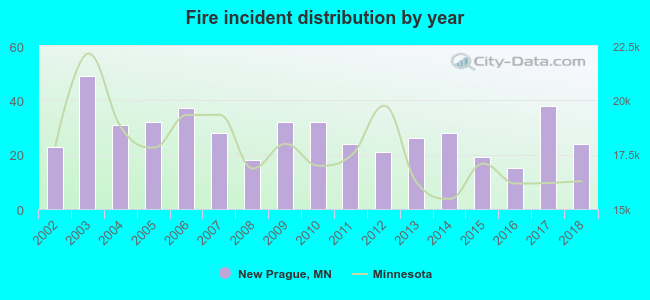 Based on the data from the years 2002 - 2018 the average number of fire incidents per year is 28. The highest number of reported fire incidents - 49 took place in 2003, and the least - 15 in 2016. The data has a growing trend.
The average number of yearly fire incidents per 10k residents in New Prague, MN compared to nearest cities:
(Note: Based on data for the last 3 years, including only cities with population 5,000 and above)
| New Prague: | 34.0 |
| Jordan: | 35.7 |
| Belle Plaine: | 25.6 |
| Prior Lake: | 22.2 |
| Shakopee: | 24.1 |
| Savage: | 9.7 |
| Chaska: | 13.6 |
| Lakeville: | 13.6 |
| Burnsville: | 19.6 |
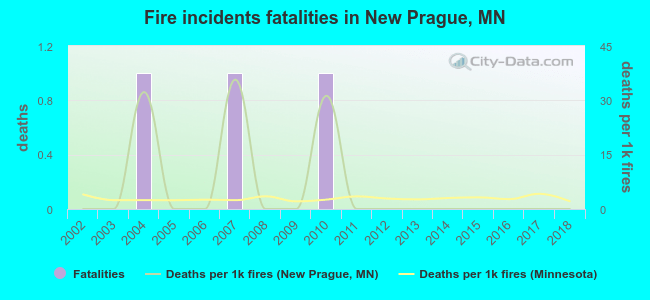 According to the data from the years 2002 - 2018 the average number of fire-related yearly deaths is 0. The highest number of deaths - 1 took place in 2004, and the lowest - 0 in 2002. The data has a constant trend.
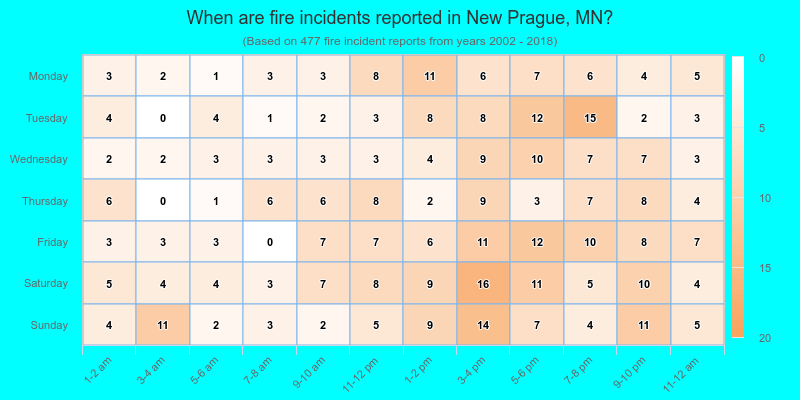
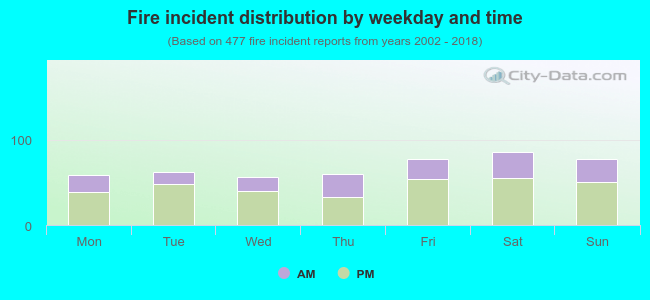 33.1% incidents where reported in the morning and 66.9% in the evening. The most fires (18.0%) took place on Saturday, and the least (11.7%) on Wednesday.
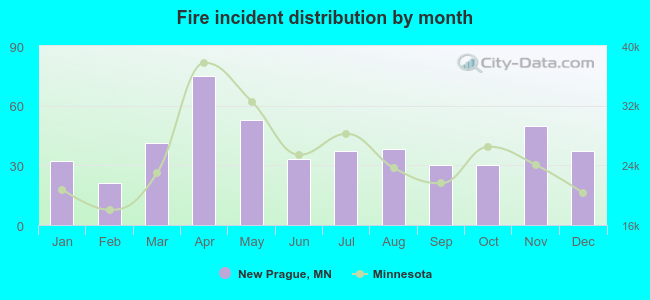 According to the 477 fire incident reports from years 2002 - 2018 most fires (15.7%) took place during April, and the least (4.4%) in February.
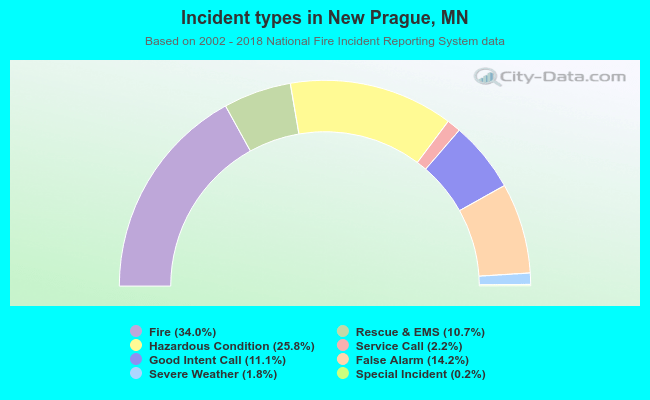 Out of all 1,405 cases reported during the years 2002 - 2018, the most belonged to the categories: Fire (34.0%), Rescue & EMS (25.8%), and Good Intent Call (14.2%).
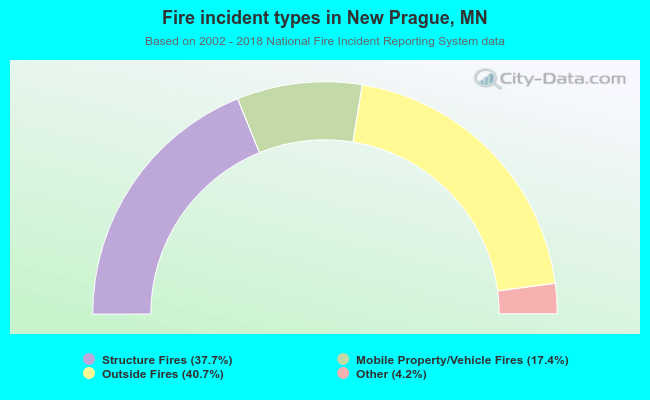 When looking into fire subcategories, the most incidents belonged to: Outside Fires (40.7%), and Structure Fires (37.7%).