Richmond: Fire Incidents, Michigan (MI)
Where are fire incidents reported in Richmond, MI
Something went wrong! Please refresh the page.
|
| |||||||||||||||||||||||||||||||||||||||||||||||||||||||||||||||||||||||||||||||||||||||||||||||||||||||||||||
2002 - 2018 National Fire Incident Reporting System (NFIRS) incidents
- Incident types reported to NFIRS in Richmond, MI
- 37645.0%Rescue & EMS
- 24028.7%Hazardous Condition
- 14317.1%Fire
- 273.2%Good Intent Call
- 253.0%False Alarm
- 192.3%Service Call
- 40.5%Severe Weather
- 10.1%Overpressure Rupture
- 10.1%Special Incident
- Fire incident types reported to NFIRS in Richmond, MI
- 8257.3%Structure Fires
- 2819.6%Mobile Property/Vehicle Fires
- 2316.1%Outside Fires
- 107.0%Other
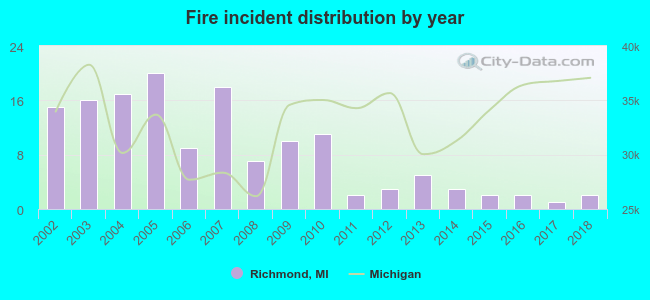 Based on the data from the years 2002 - 2018 the average number of fires per year is 8. The highest number of reported fire incidents - 20 took place in 2005, and the least - 1 in 2017. The data has a dropping trend.
The average number of yearly fire incidents per 10k residents in Richmond, MI compared to nearest cities:
(Note: Based on data for the last 3 years, including only cities with population 5,000 and above)
| Richmond: | 2.9 |
| New Baltimore: | 12.2 |
| Marysville: | 30.6 |
| Mount Clemens: | 50.0 |
| Shelby: | 5.2 |
| Port Huron: | 54.7 |
| Rochester: | 16.9 |
| Sterling Heights: | 18.3 |
| Fraser: | 15.7 |

 39.9% incidents where reported in the morning and 60.1% in the evening. The most fires (18.2%) took place on Saturday, and the least (8.4%) on Friday.
 According to the 143 incident reports from years 2002 - 2018 most fires (14.7%) took place during May, and the least (4.2%) in March.
 Out of all 836 cases reported during the years 2002 - 2018, the most belonged to the categories: Rescue & EMS (45.0%), Hazardous Condition (28.7%), and Fire (17.1%).
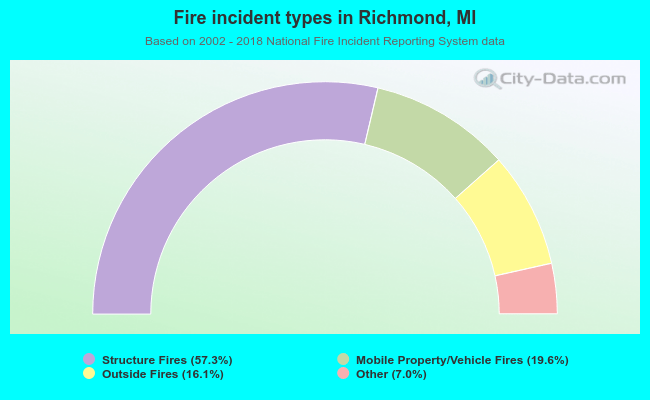 When looking into fire subcategories, the most incidents belonged to: Structure Fires (57.3%), and Mobile Property/Vehicle Fires (19.6%).