Marysville: Fire Incidents, Michigan (MI)
Where are fire incidents reported in Marysville, MI
Something went wrong! Please refresh the page.
|
| |||||||||||||||||||||||||||||||||||||||||||||||||||||||||||||||||||||||||||||||||||||||||||||||||||||||||||||
2002 - 2018 National Fire Incident Reporting System (NFIRS) incidents
- Incident types reported to NFIRS in Marysville, MI
- 4,19444.2%Rescue & EMS
- 2,93130.9%Service Call
- 1,07011.3%Hazardous Condition
- 5055.3%Good Intent Call
- 4504.7%Fire
- 2532.7%False Alarm
- 460.5%Severe Weather
- 350.4%Special Incident
- Fire incident types reported to NFIRS in Marysville, MI
- 28763.8%Structure Fires
- 8518.9%Outside Fires
- 6614.7%Mobile Property/Vehicle Fires
- 122.7%Other
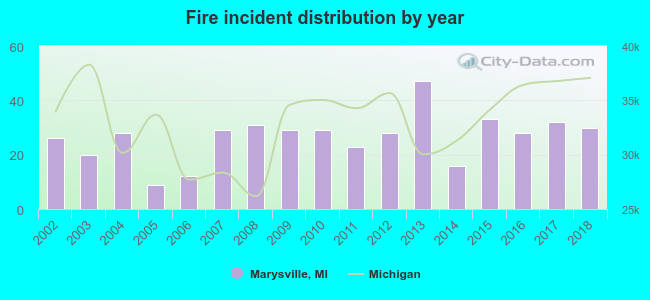 Based on the data from the years 2002 - 2018 the average number of fires per year is 26. The highest number of reported fires - 47 took place in 2013, and the least - 9 in 2005. The data has an increasing trend.
The average number of yearly fire incidents per 10k residents in Marysville, MI compared to nearest cities:
(Note: Based on data for the last 3 years, including only cities with population 5,000 and above)
| Marysville: | 30.6 |
| Port Huron: | 54.7 |
| Richmond: | 2.9 |
| New Baltimore: | 12.2 |
| Mount Clemens: | 50.0 |
| Shelby: | 5.2 |
| Fraser: | 15.7 |
| Sterling Heights: | 18.3 |
| Rochester: | 16.9 |

 Based on the reports from the years 2002 - 2018 the average number of fire-related casualties per year is 1. The highest number of injuries - 4 took place in 2008, and the lowest - 0 in 2003. The data has a decreasing trend.
 33.6% incidents where reported in the morning and 66.4% in the evening. The most fires (18.2%) took place on Tuesday, and the least (11.3%) on Sunday.
 Based on the 450 fire incidents from years 2002 - 2018 most fires (11.1%) took place during November, and the least (6.7%) in October.
 Out of all 9,487 cases reported during the years 2002 - 2018, the most belonged to the categories: Rescue & EMS (44.2%), Service Call (30.9%), and Hazardous Condition (11.3%).
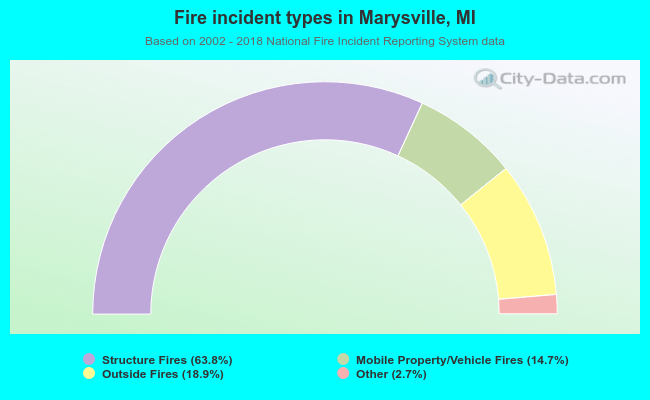 When looking into fire subcategories, the most reports belonged to: Structure Fires (63.8%), and Outside Fires (18.9%).