New Baltimore: Fire Incidents, Michigan (MI)
Where are fire incidents reported in New Baltimore, MI
Something went wrong! Please refresh the page.
|
| |||||||||||||||||||||||||||||||||||||||||||||||||||||||||||||||||||||||||||||||||||||||||||||||||||||||||||||
2002 - 2018 National Fire Incident Reporting System (NFIRS) incidents
- Incident types reported to NFIRS in New Baltimore, MI
- 2,88353.3%Rescue & EMS
- 72913.5%Hazardous Condition
- 62011.5%Fire
- 55710.3%False Alarm
- 4949.1%Service Call
- 1152.1%Good Intent Call
- 120.2%Special Incident
- Fire incident types reported to NFIRS in New Baltimore, MI
- 30348.9%Structure Fires
- 21634.8%Other
- 6610.6%Outside Fires
- 355.6%Mobile Property/Vehicle Fires
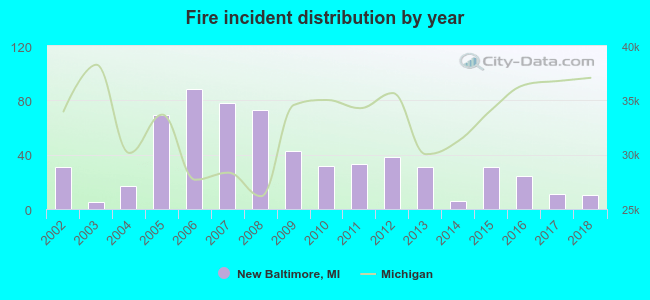 According to the data from the years 2002 - 2018 the average number of fire incidents per year is 36. The highest number of reported fires - 88 took place in 2006, and the least - 5 in 2003. The data has a declining trend.
The average number of yearly fire incidents per 10k residents in New Baltimore, MI compared to nearest cities:
(Note: Based on data for the last 3 years, including only cities with population 5,000 and above)
| New Baltimore: | 12.2 |
| Richmond: | 2.9 |
| Mount Clemens: | 50.0 |
| Fraser: | 15.7 |
| Shelby: | 5.2 |
| Roseville: | 29.2 |
| Sterling Heights: | 18.3 |
| Eastpointe: | 32.2 |
| Grosse Pointe Woods: | 17.1 |
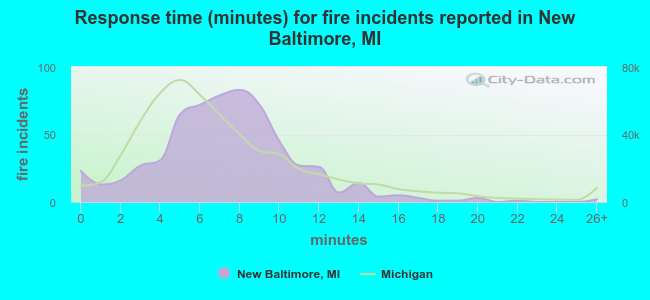 The median response time based on all reported fire incidents is 7 minutes. This is about the same as the state median value.
The median response time in New Baltimore, MI compared to nearest cities:
(Note: Based on data for all years, including only cities with at least 500 fire incidents)
| New Baltimore: | 7 minutes |
| Mount Clemens: | 3 minutes |
| St. Clair Shores: | 4 minutes |
| Roseville: | 4 minutes |
| Sterling Heights: | 5 minutes |
| Eastpointe: | 4 minutes |
| Harper Woods: | 3 minutes |
| Warren: | 5 minutes |
| Center Line: | 3 minutes |
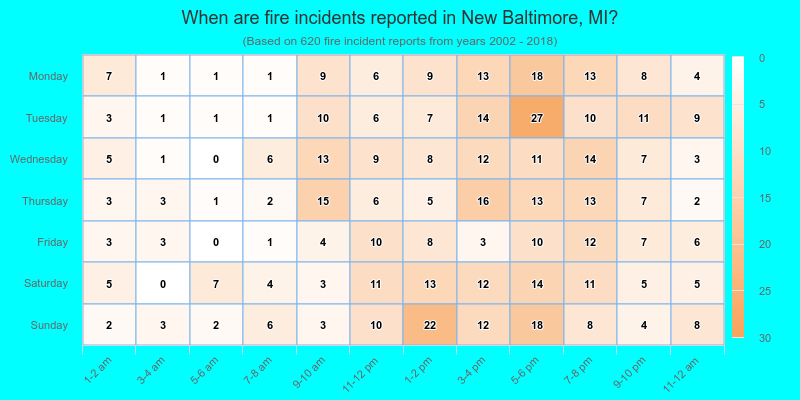
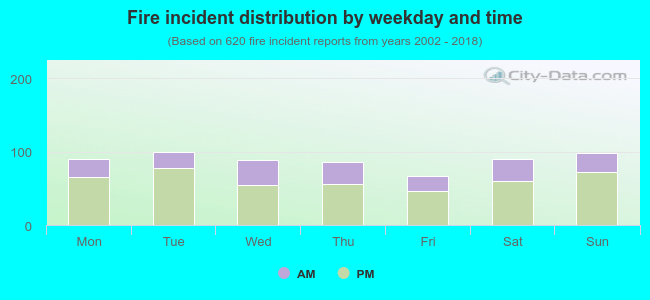 30.3% incidents where reported in the morning and 69.7% in the evening. The most fires (16.1%) took place on Tuesday, and the least (10.8%) on Friday.
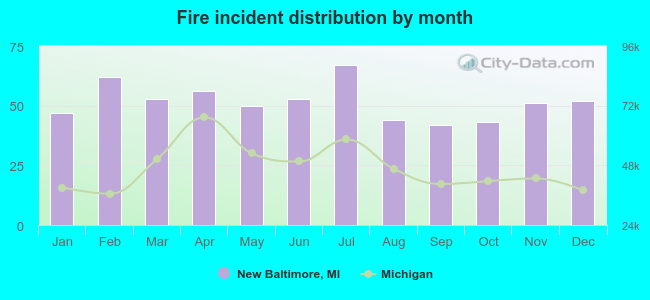 Based on the 620 incident reports from years 2002 - 2018 most fires (10.8%) took place during July, and the least (6.8%) in September.
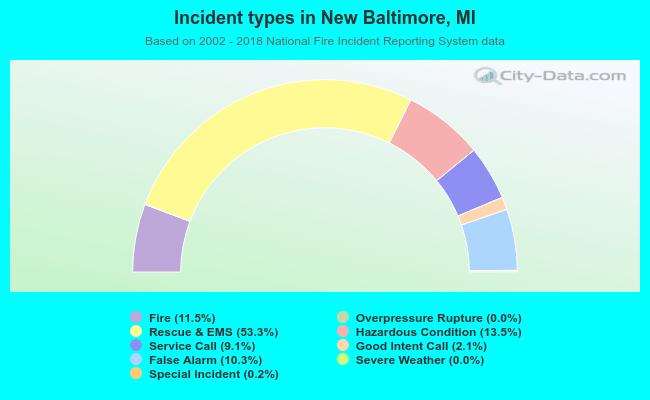 Out of all 5,414 cases reported during the years 2002 - 2018, the most belonged to the categories: Rescue & EMS (53.3%), Hazardous Condition (13.5%), and Fire (11.5%).
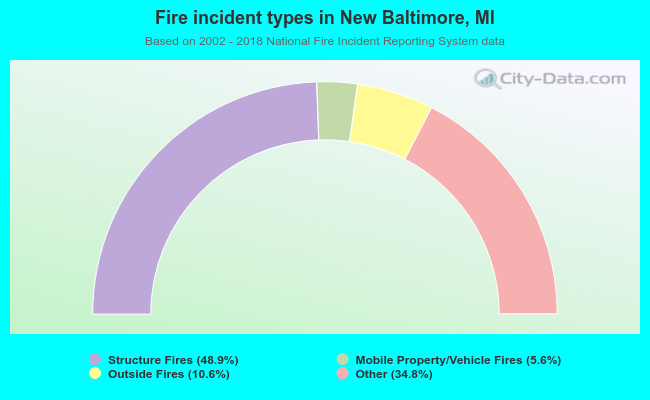 When looking into fire subcategories, the most reports belonged to: Structure Fires (48.9%), and Other (34.8%).