Fraser: Fire Incidents, Michigan (MI)
Where are fire incidents reported in Fraser, MI
Something went wrong! Please refresh the page.
|
| |||||||||||||||||||||||||||||||||||||||||||||||||||||||||||||||||||||||||||||||||||||||||||||||||||||||||||||
2002 - 2018 National Fire Incident Reporting System (NFIRS) incidents
- Incident types reported to NFIRS in Fraser, MI
- 57035.9%Rescue & EMS
- 35922.6%Hazardous Condition
- 25516.1%Fire
- 20112.7%False Alarm
- 16310.3%Good Intent Call
- 322.0%Service Call
- 30.2%Overpressure Rupture
- 20.1%Special Incident
- Fire incident types reported to NFIRS in Fraser, MI
- 12247.8%Structure Fires
- 5421.2%Mobile Property/Vehicle Fires
- 5019.6%Outside Fires
- 2911.4%Other
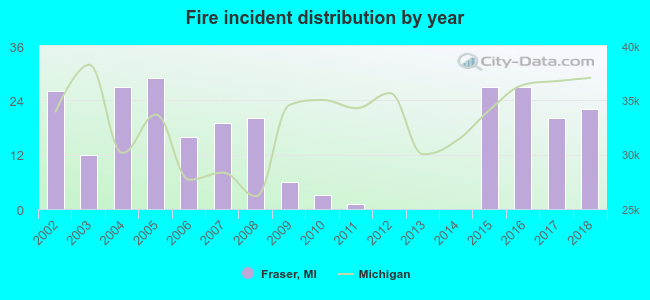 Based on the data from the years 2002 - 2018 the average number of fire incidents per year is 15. The highest number of reported fires - 29 took place in 2005, and the least - 0 in 2012. The data has a declining trend.
The average number of yearly fire incidents per 10k residents in Fraser, MI compared to nearest cities:
(Note: Based on data for the last 3 years, including only cities with population 5,000 and above)
| Fraser: | 15.7 |
| Roseville: | 29.2 |
| Warren: | 21.1 |
| Eastpointe: | 32.2 |
| Sterling Heights: | 18.3 |
| Center Line: | 78.6 |
| Mount Clemens: | 50.0 |
| Harper Woods: | 17.7 |
| Grosse Pointe Woods: | 17.1 |
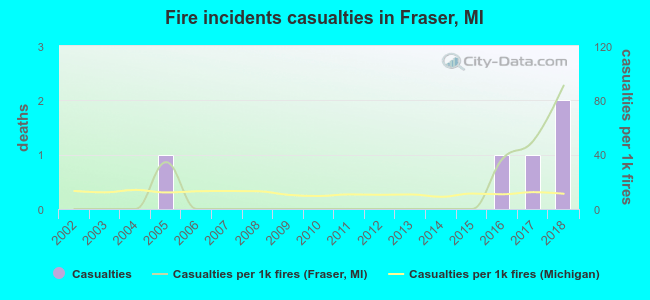 Based on the reports from the years 2002 - 2018 the average number of fire-related casualties per year is 0. The highest number of casualties - 2 took place in 2018, and the lowest - 0 in 2002. The data has a rising trend.
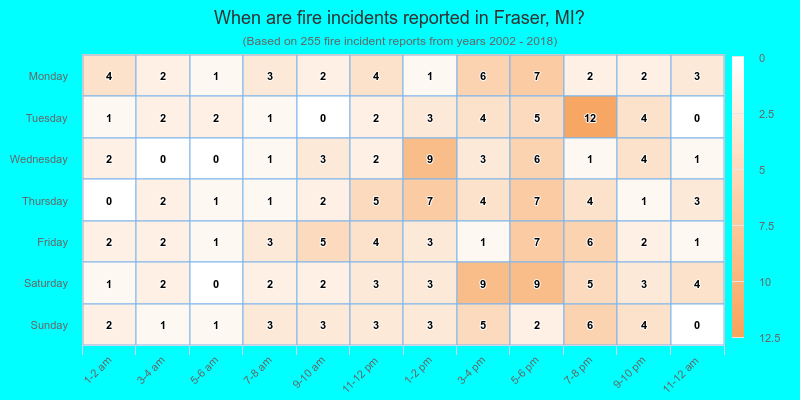
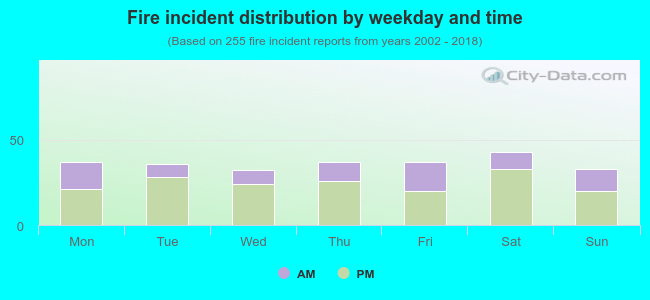 32.5% incidents where reported in the morning and 67.5% in the evening. The most fires (16.9%) took place on Saturday, and the least (12.5%) on Wednesday.
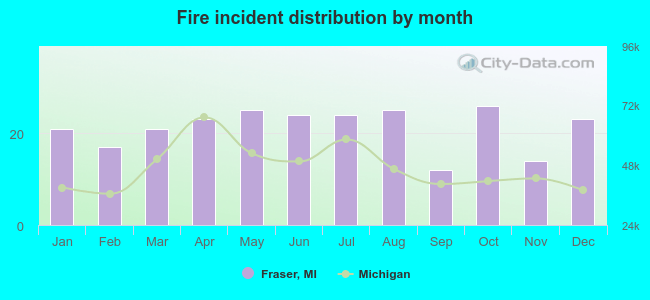 Based on the 255 fires from years 2002 - 2018 most fires (10.2%) took place during October, and the least (4.7%) in September.
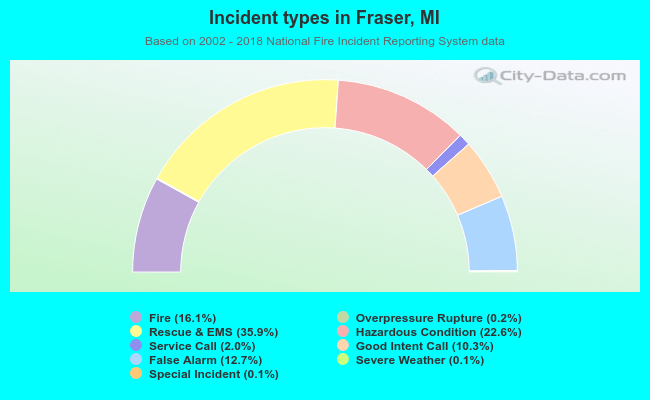 Out of all 1,586 cases reported during the years 2002 - 2018, the most belonged to the categories: Rescue & EMS (35.9%), Hazardous Condition (22.6%), and Fire (16.1%).
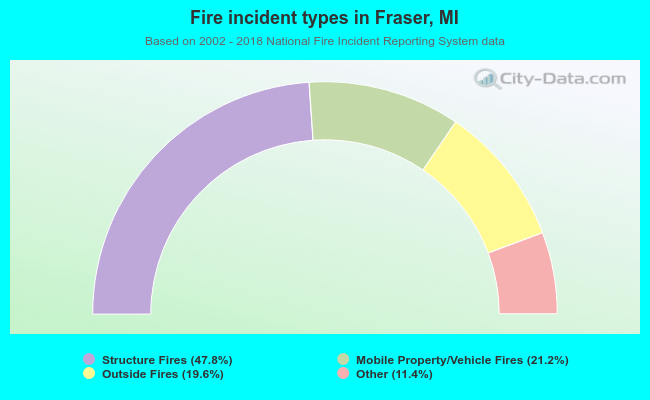 When looking into fire subcategories, the most reports belonged to: Structure Fires (47.8%), and Mobile Property/Vehicle Fires (21.2%).