Woodstock: Fire Incidents, Georgia (GA)
Where are fire incidents reported in Woodstock, GA
Something went wrong! Please refresh the page.
| Fire incidents reported | |
|---|---|
| Sreet name | Count |
| 92 HWY | 212 |
| ARNOLD MILL RD | 200 |
| BELLS FERRY RD | 182 |
| 575 HWY | 132 |
| TOWNE LAKE PKY | 88 |
| MAIN ST | 78 |
| TRICKUM RD | 74 |
| TOWNE LAKE PKWY | 72 |
| DUPREE RD | 68 |
| EAGLE DR | 58 |
| EAST CHEROKEE DR | 58 |
| DOWNSBY LN | 52 |
| HICKORY FLAT HWY | 52 |
| HIGHWAY 92 | 52 |
| HWY 92 | 52 |
| TOWNE LAKE HILLS SOUTH DR | 48 |
| SYCAMORE LN | 46 |
| NEESE RD | 40 |
| VICTORIA RD | 38 |
| BASCOMB CARMEL RD | 34 |
| ROPE MILL RD | 34 |
| 92 | 32 |
| HAMES RD | 32 |
| TRIPP RD | 30 |
| 575 EXPY | 28 |
| CHAMBERS ST | 28 |
| EAGLE WATCH DR | 28 |
| I-575 HWY | 28 |
| FOUNTAIN CIR | 26 |
| STOCKWOOD DR | 26 |
| Other | 1,896 |
2002 - 2018 National Fire Incident Reporting System (NFIRS) incidents
- Incident types reported to NFIRS in Woodstock, GA
- 36,19757.4%Rescue & EMS
- 7,85212.5%Good Intent Call
- 7,53111.9%Service Call
- 4,2876.8%Hazardous Condition
- 3,8246.1%Fire
- 2,9724.7%False Alarm
- 2830.4%Special Incident
- Fire incident types reported to NFIRS in Woodstock, GA
- 1,57741.2%Structure Fires
- 1,54840.5%Outside Fires
- 47612.4%Mobile Property/Vehicle Fires
- 2235.8%Other
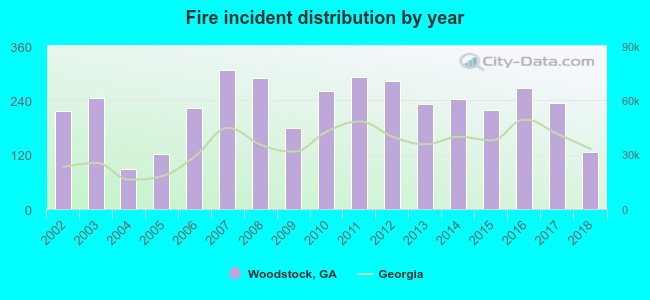 According to the data from the years 2002 - 2018 the average number of fire incidents per year is 225. The highest number of reported fire incidents - 307 took place in 2007, and the least - 89 in 2004. The data has a declining trend.
The average number of yearly fire incidents per 10k residents in Woodstock, GA compared to nearest cities:
(Note: Based on data for the last 3 years, including only cities with population 5,000 and above)
| Woodstock: | 75.2 |
| Holly Springs: | 34.8 |
| Kennesaw: | 49.7 |
| Canton: | 94.2 |
| Acworth: | 85.7 |
| Marietta: | 90.3 |
| Roswell: | 18.7 |
| Milton: | 24.2 |
| Alpharetta: | 29.3 |
 The median response time based on all reported fire incidents is 7 minutes. This is comparable to the state median value.
The median response time in Woodstock, GA compared to nearest cities:
(Note: Based on data for all years, including only cities with at least 500 fire incidents)
| Woodstock: | 7 minutes |
| Kennesaw: | 6 minutes |
| Canton: | 8 minutes |
| Acworth: | 7 minutes |
| Marietta: | 6 minutes |
| Roswell: | 6 minutes |
| Milton: | 6 minutes |
| Alpharetta: | 5 minutes |
| Sandy Springs: | 6 minutes |
 According to the data from the years 2002 - 2018 the average number of fire-related fatalities per year is 0. The highest number of reported deaths - 2 took place in 2002, and the lowest - 0 in 2004. The data has a declining trend.
The average number of deaths per 1,000 fires is 2. This indicator was the highest - 9 in 2002, and the lowest 0 in 2004. The trend for fatalities per 1,000 fire incidents is decreasing. Compared to the state value the number of fatalities per 1,000 fires is similar.
According to the data from the years 2002 - 2018 the average number of fire-related fatalities per year is 0. The highest number of reported deaths - 2 took place in 2002, and the lowest - 0 in 2004. The data has a declining trend.
The average number of deaths per 1,000 fires is 2. This indicator was the highest - 9 in 2002, and the lowest 0 in 2004. The trend for fatalities per 1,000 fire incidents is decreasing. Compared to the state value the number of fatalities per 1,000 fires is similar.Deaths per 1,000 incidents in Woodstock, GA compared to nearest cities:
(Note: Based on data for all years, including only cities with at least 2,500 fire incidents)
| Woodstock: | 1.8 |
| Kennesaw: | 4.7 |
| Canton: | 0.7 |
| Acworth: | 0.7 |
| Marietta: | 2.9 |
| Roswell: | 1.2 |
| Alpharetta: | 0.7 |
| Smyrna: | 4.7 |
| Cartersville: | 3.1 |
 According to the reports from the years 2002 - 2018 the average number of fire-related yearly casualties is 1. The highest number of reported casualties - 3 took place in 2017, and the lowest - 0 in 2002. The data has a constant trend.
The average number of injuries per 1,000 fire incidents is 3. This indicator was the highest - 13 in 2017, and the lowest 0 in 2002. The trend for casualties per 1,000 fire incidents is constant. Compared to the state value the number of injuries per 1,000 incidents is much lower.
According to the reports from the years 2002 - 2018 the average number of fire-related yearly casualties is 1. The highest number of reported casualties - 3 took place in 2017, and the lowest - 0 in 2002. The data has a constant trend.
The average number of injuries per 1,000 fire incidents is 3. This indicator was the highest - 13 in 2017, and the lowest 0 in 2002. The trend for casualties per 1,000 fire incidents is constant. Compared to the state value the number of injuries per 1,000 incidents is much lower.Casualties per 1,000 incidents in Woodstock, GA compared to nearest cities:
(Note: Based on data for all years, including only cities with at least 500 fire incidents)
| Woodstock: | 3.1 |
| Kennesaw: | 11.0 |
| Canton: | 1.1 |
| Acworth: | 13.6 |
| Marietta: | 24.8 |
| Roswell: | 19.4 |
| Milton: | 11.8 |
| Alpharetta: | 10.5 |
| Sandy Springs: | 7.1 |
 24.6% incidents where reported in the morning and 75.4% in the evening. The most fires (16.7%) took place on Saturday, and the least (12.2%) on Wednesday.
 Based on the 3,824 fire incidents from years 2002 - 2018 most fires (11.1%) took place during March, and the least (6.4%) in August.
 Out of all 63,066 cases reported during the years 2002 - 2018, the most belonged to the categories: Rescue & EMS (57.4%), Good Intent Call (12.5%), and Service Call (11.9%).
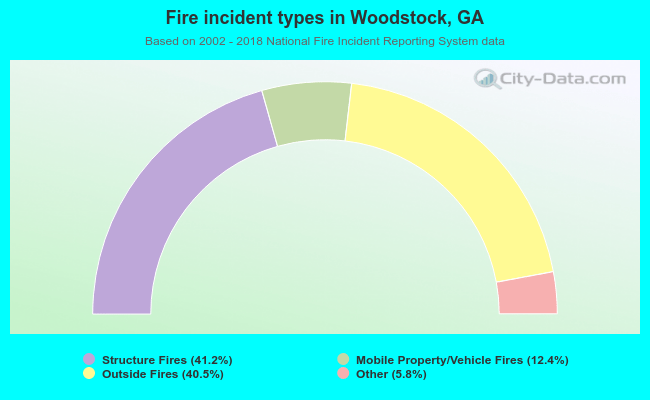 When looking into fire subcategories, the most reports belonged to: Structure Fires (41.2%), and Outside Fires (40.5%).