Milton: Fire Incidents, Georgia (GA)
Where are fire incidents reported in Milton, GA
Something went wrong! Please refresh the page.
| Fire incidents reported | |
|---|---|
| Sreet name | Count |
| HOPEWELL RD | 82 |
| MORRIS RD | 52 |
| FREEMANVILLE RD | 50 |
| HIGHWAY 9 | 50 |
| ARNOLD MILL RD | 44 |
| BIRMINGHAM HWY | 42 |
| DEER TRL | 38 |
| BETHANY RD | 34 |
| WINDWARD PKWY | 26 |
| COGBURN RD | 22 |
| PROVIDENCE RD | 22 |
| THOMPSON RD | 22 |
| VERIZON PL | 22 |
| CRABAPPLE RD | 18 |
| ALSTONEFIELD DR | 16 |
| BIRMINGHAM RD | 16 |
| DEERFIELD PKWY | 16 |
| MOUNTAIN RD | 16 |
| DEER POINT CT | 14 |
| MAYFIELD RD | 14 |
| DEER TR | 12 |
| ARCHGATE CT | 10 |
| CHADWICK FARM BLVD | 10 |
| COMMONWEALTH CIR | 10 |
| FREEMANWOOD LN | 10 |
| HENDERSON RD | 10 |
| HWY 9 | 10 |
| MARRYWOOD CT | 10 |
| MORNING PARK CIR | 10 |
| TRIPLE CROWN DR | 10 |
| Other | 42 |
2007 - 2018 National Fire Incident Reporting System (NFIRS) incidents
- Incident types reported to NFIRS in Milton, GA
- 4,11843.2%Rescue & EMS
- 1,91220.1%Good Intent Call
- 1,18512.4%Service Call
- 9229.7%False Alarm
- 7608.0%Fire
- 5525.8%Hazardous Condition
- 350.4%Severe Weather
- 310.3%Special Incident
- 120.1%Overpressure Rupture
- Fire incident types reported to NFIRS in Milton, GA
- 33443.9%Outside Fires
- 30940.7%Structure Fires
- 7610.0%Mobile Property/Vehicle Fires
- 415.4%Other
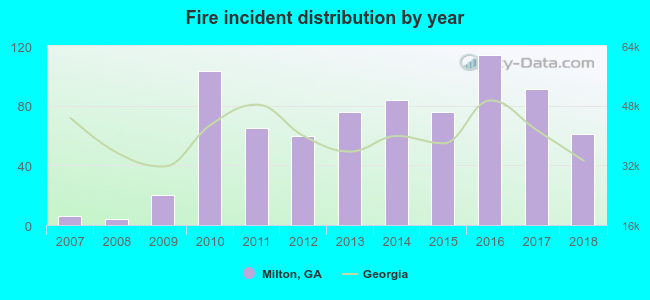 According to the data from the years 2007 - 2018 the average number of fire incidents per year is 63. The highest number of fires - 114 took place in 2016, and the least - 4 in 2008. The data has an increasing trend.
The average number of yearly fire incidents per 10k residents in Milton, GA compared to nearest cities:
(Note: Based on data for the last 3 years, including only cities with population 5,000 and above)
| Milton: | 24.2 |
| Alpharetta: | 29.3 |
| Roswell: | 18.7 |
| Johns Creek: | 8.3 |
| Holly Springs: | 34.8 |
| Cumming: | 582.4 |
| Canton: | 94.2 |
| Woodstock: | 75.2 |
| Duluth: | 65.1 |
 The median response time based on all reported fire incidents is 6 minutes. This is similar to the Georgia median value.
The median response time in Milton, GA compared to nearest cities:
(Note: Based on data for all years, including only cities with at least 500 fire incidents)
| Milton: | 6 minutes |
| Alpharetta: | 5 minutes |
| Roswell: | 6 minutes |
| Johns Creek: | 6 minutes |
| Cumming: | 7 minutes |
| Canton: | 8 minutes |
| Woodstock: | 7 minutes |
| Duluth: | 7 minutes |
| Ball Ground: | 9 minutes |
 According to the data from the years 2007 - 2018 the average number of fire-related yearly casualties is 1. The highest number of reported casualties - 5 took place in 2013, and the lowest - 0 in 2007. The data has a constant trend.
The average number of injuries per 1,000 fires is 10. This indicator was the highest - 66 in 2013, and the lowest 0 in 2007. The trend for casualties per 1,000 fire incidents is constant. Compared to the Georgia value the number of casualties per 1,000 fire incidents is higher.
According to the data from the years 2007 - 2018 the average number of fire-related yearly casualties is 1. The highest number of reported casualties - 5 took place in 2013, and the lowest - 0 in 2007. The data has a constant trend.
The average number of injuries per 1,000 fires is 10. This indicator was the highest - 66 in 2013, and the lowest 0 in 2007. The trend for casualties per 1,000 fire incidents is constant. Compared to the Georgia value the number of casualties per 1,000 fire incidents is higher.Casualties per 1,000 incidents in Milton, GA compared to nearest cities:
(Note: Based on data for all years, including only cities with at least 500 fire incidents)
| Milton: | 11.8 |
| Alpharetta: | 10.5 |
| Roswell: | 19.4 |
| Johns Creek: | 16.1 |
| Cumming: | 7.6 |
| Canton: | 1.1 |
| Woodstock: | 3.1 |
| Duluth: | 15.3 |
| Ball Ground: | 4.6 |
 26.2% incidents where reported in the morning and 73.8% in the evening. The most fires (18.7%) took place on Saturday, and the least (11.2%) on Wednesday.
 According to the 760 fire incident reports from years 2007 - 2018 most fires (11.7%) took place during March, and the least (5.3%) in June.
 Out of all 9,527 cases reported during the years 2007 - 2018, the most belonged to the categories: Rescue & EMS (43.2%), Good Intent Call (20.1%), and Service Call (12.4%).
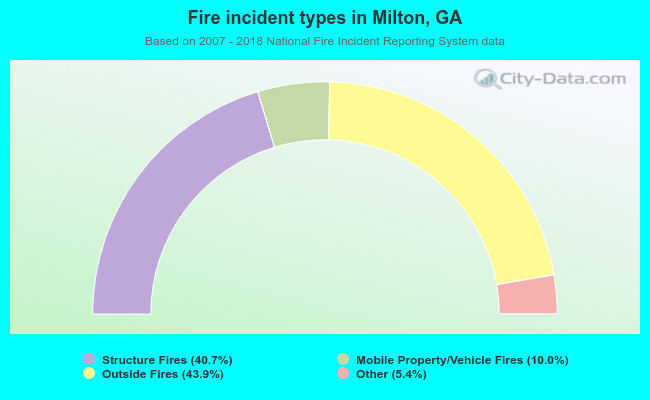 When looking into fire subcategories, the most incidents belonged to: Outside Fires (43.9%), and Structure Fires (40.7%).