Roswell: Fire Incidents, Georgia (GA)
Where are fire incidents reported in Roswell, GA
Something went wrong! Please refresh the page.
| Fire incidents reported | |
|---|---|
| Sreet name | Count |
| HOLCOMB BRIDGE RD | 236 |
| WOODSTOCK RD | 74 |
| HOLCOMB BRIDGE ROAD | 70 |
| MANSELL RD | 62 |
| ALPHARETTA HWY | 60 |
| CROSSVILLE RD | 58 |
| ALPHARETTA HW | 54 |
| GEORGIA 400 | 54 |
| RIVERWOOD LN | 40 |
| HEMINGWAY LN | 38 |
| OLD ALABAMA RD | 38 |
| ALPHARETTA HIGHWAY | 36 |
| CALIBRE CREEK PW | 36 |
| CRABAPPLE RD | 36 |
| ALPHARETTA ST | 34 |
| HEMBREE RD | 34 |
| AZALEA DR | 30 |
| HOUZE RD | 28 |
| RAINTREE DR | 28 |
| SARATOGA DR | 28 |
| CHATTAHOOCHEE CIR | 26 |
| EAGLES CREST VILLAGE LN | 26 |
| OLD HOLCOMB BRIDGE WAY | 26 |
| NORCROSS ST | 24 |
| ATLANTA ST | 22 |
| HARBOR LANDING | 22 |
| KING RD | 22 |
| OLD ROSWELL RD | 22 |
| SHALLOWFORD RD | 22 |
| CHATTAHOOCHEE CI | 20 |
| Other | 1,221 |
2003 - 2018 National Fire Incident Reporting System (NFIRS) incidents
- Incident types reported to NFIRS in Roswell, GA
- 23,24755.3%Rescue & EMS
- 5,53213.2%Good Intent Call
- 4,78311.4%Service Call
- 3,0517.3%False Alarm
- 2,7096.4%Hazardous Condition
- 2,5276.0%Fire
- 690.2%Severe Weather
- 570.1%Overpressure Rupture
- Fire incident types reported to NFIRS in Roswell, GA
- 1,06041.9%Structure Fires
- 1,01940.3%Outside Fires
- 40716.1%Mobile Property/Vehicle Fires
- 411.6%Other
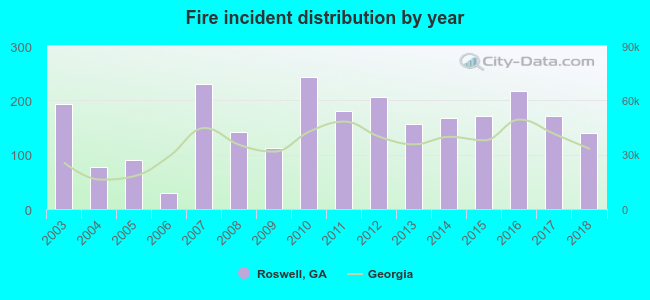 Based on the data from the years 2003 - 2018 the average number of fires per year is 158. The highest number of fires - 243 took place in 2010, and the least - 30 in 2006. The data has a dropping trend.
The average number of yearly fire incidents per 10k residents in Roswell, GA compared to nearest cities:
(Note: Based on data for the last 3 years, including only cities with population 5,000 and above)
| Roswell: | 18.7 |
| Alpharetta: | 29.3 |
| Dunwoody: | 5.3 |
| Sandy Springs: | 20.1 |
| Milton: | 24.2 |
| Johns Creek: | 8.3 |
| Doraville: | 21.8 |
| Norcross: | 137.6 |
| Chamblee: | 34.8 |
 The median response time based on all reported fire incidents is 6 minutes. This is comparable to the Georgia median value.
The median response time in Roswell, GA compared to nearest cities:
(Note: Based on data for all years, including only cities with at least 500 fire incidents)
| Roswell: | 6 minutes |
| Alpharetta: | 5 minutes |
| Sandy Springs: | 6 minutes |
| Milton: | 6 minutes |
| Johns Creek: | 6 minutes |
| Norcross: | 7 minutes |
| Chamblee: | 7 minutes |
| Woodstock: | 7 minutes |
| Duluth: | 7 minutes |
 Based on the reports from the years 2003 - 2018 the average number of fire-related yearly deaths is 0. The highest number of reported deaths - 1 took place in 2012, and the lowest - 0 in 2003. The data has an increasing trend.
The average number of deaths per 1,000 fire incidents is 1. This indicator was the highest - 7 in 2018, and the lowest 0 in 2003. The trend for deaths per 1,000 incidents is growing. Compared to the Georgia value the number of fatalities per 1,000 incidents is lower.
Based on the reports from the years 2003 - 2018 the average number of fire-related yearly deaths is 0. The highest number of reported deaths - 1 took place in 2012, and the lowest - 0 in 2003. The data has an increasing trend.
The average number of deaths per 1,000 fire incidents is 1. This indicator was the highest - 7 in 2018, and the lowest 0 in 2003. The trend for deaths per 1,000 incidents is growing. Compared to the Georgia value the number of fatalities per 1,000 incidents is lower.
 Based on the reports from the years 2003 - 2018 the average number of fire-related casualties per year is 3. The highest number of reported injuries - 8 took place in 2011, and the lowest - 0 in 2006. The data has a rising trend.
The average number of casualties per 1,000 fires is 19. This indicator was the highest - 44 in 2011, and the lowest 0 in 2006. The trend for casualties per 1,000 fires is increasing. Compared to the Georgia value the number of injuries per 1,000 incidents is much higher.
Based on the reports from the years 2003 - 2018 the average number of fire-related casualties per year is 3. The highest number of reported injuries - 8 took place in 2011, and the lowest - 0 in 2006. The data has a rising trend.
The average number of casualties per 1,000 fires is 19. This indicator was the highest - 44 in 2011, and the lowest 0 in 2006. The trend for casualties per 1,000 fires is increasing. Compared to the Georgia value the number of injuries per 1,000 incidents is much higher.Casualties per 1,000 incidents in Roswell, GA compared to nearest cities:
(Note: Based on data for all years, including only cities with at least 500 fire incidents)
| Roswell: | 19.4 |
| Alpharetta: | 10.5 |
| Sandy Springs: | 7.1 |
| Milton: | 11.8 |
| Johns Creek: | 16.1 |
| Norcross: | 19.0 |
| Chamblee: | 3.5 |
| Woodstock: | 3.1 |
| Duluth: | 15.3 |
 27.5% incidents where reported in the morning and 72.5% in the evening. The most fires (16.5%) took place on Sunday, and the least (12.1%) on Thursday.
 According to the 2,527 fire incident reports from years 2003 - 2018 most fires (9.8%) took place during August, and the least (7.2%) in May.
 Out of all 42,008 cases reported during the years 2003 - 2018, the most belonged to the categories: Rescue & EMS (55.3%), Good Intent Call (13.2%), and Service Call (11.4%).
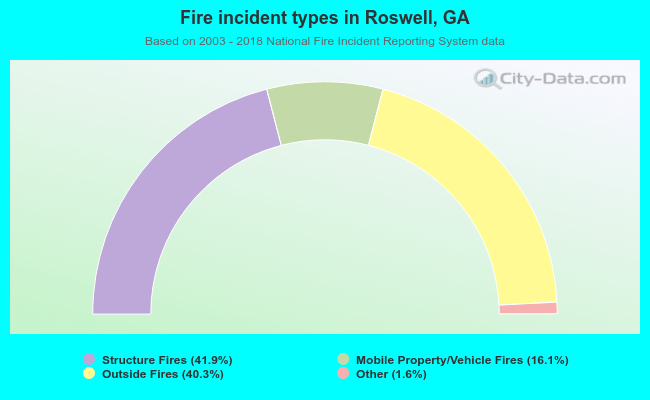 When looking into fire subcategories, the most incidents belonged to: Structure Fires (41.9%), and Outside Fires (40.3%).