Smyrna: Fire Incidents, Georgia (GA)
Where are fire incidents reported in Smyrna, GA
Something went wrong! Please refresh the page.
| Fire incidents reported | |
|---|---|
| Sreet name | Count |
| COBB DR | 356 |
| WINDY HILL RD | 234 |
| ATLANTA RD | 224 |
| COBB PKWY | 122 |
| SPRING RD | 110 |
| OLD CONCORD RD | 106 |
| CONCORD RD | 84 |
| SOUTH COBB DR | 84 |
| LAKE PARK DR | 68 |
| EAST WEST CN | 60 |
| BENSON POOLE RD | 58 |
| VININGS PKWY | 56 |
| COBB | 52 |
| CUMBERLAND BLVD | 52 |
| EW CONN | 50 |
| HURT RD | 44 |
| OAKDALE RD | 42 |
| PAT MELL RD | 40 |
| WALTON WAY | 40 |
| COUNTRY PARK DR | 36 |
| KING SPRINGS RD | 36 |
| GALLERIA LN | 34 |
| SPRING HILL PKWY | 34 |
| COBB PK | 32 |
| COOPER LAKE RD | 32 |
| WOODLANDS DR | 32 |
| WINCHESTER TRL | 30 |
| EW CONN | 28 |
| I285 EXPY | 28 |
| ROSWELL ST | 28 |
| Other | 301 |
2003 - 2018 National Fire Incident Reporting System (NFIRS) incidents
- Incident types reported to NFIRS in Smyrna, GA
- 19,70452.1%Rescue & EMS
- 5,47914.5%Good Intent Call
- 4,30111.4%Service Call
- 2,8797.6%False Alarm
- 2,8037.4%Hazardous Condition
- 2,5336.7%Fire
- 560.1%Special Incident
- 400.1%Severe Weather
- Fire incident types reported to NFIRS in Smyrna, GA
- 1,03240.7%Outside Fires
- 1,02240.3%Structure Fires
- 46118.2%Mobile Property/Vehicle Fires
- 180.7%Other
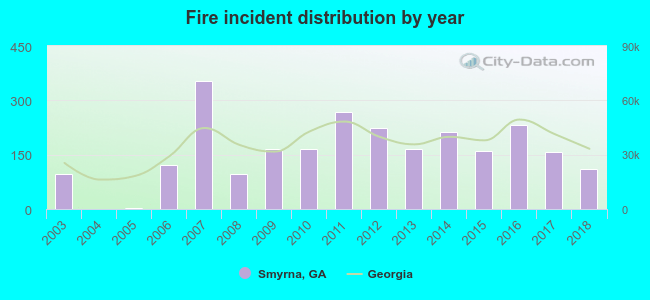 According to the data from the years 2003 - 2018 the average number of fire incidents per year is 158. The highest number of reported fires - 353 took place in 2007, and the least - 0 in 2004. The data has a rising trend.
The average number of yearly fire incidents per 10k residents in Smyrna, GA compared to nearest cities:
(Note: Based on data for the last 3 years, including only cities with population 5,000 and above)
| Smyrna: | 30.3 |
| Mableton: | 20.4 |
| Marietta: | 90.3 |
| Austell: | 196.1 |
| Powder Springs: | 65.1 |
| Lithia Springs: | 44.3 |
| Sandy Springs: | 20.1 |
| Atlanta: | 36.1 |
| Kennesaw: | 49.7 |
 The median response time based on all reported fire incidents is 5 minutes. This is lower than the Georgia median value.
The median response time in Smyrna, GA compared to nearest cities:
(Note: Based on data for all years, including only cities with at least 500 fire incidents)
| Smyrna: | 5 minutes |
| Mableton: | 6 minutes |
| Marietta: | 6 minutes |
| Austell: | 5 minutes |
| Powder Springs: | 6 minutes |
| Lithia Springs: | 7 minutes |
| Sandy Springs: | 6 minutes |
| Atlanta: | 5 minutes |
| Kennesaw: | 6 minutes |
 Based on the data from the years 2003 - 2018 the average number of fire-related yearly deaths is 1. The highest number of deaths - 2 took place in 2007, and the lowest - 0 in 2004. The data has a constant trend.
The average number of deaths per 1,000 fires is 4. This indicator was the highest - 13 in 2017, and the lowest 0 in 2004. The trend for deaths per 1,000 incidents is decreasing. Compared to the Georgia value the number of deaths per 1,000 incidents is much higher.
Based on the data from the years 2003 - 2018 the average number of fire-related yearly deaths is 1. The highest number of deaths - 2 took place in 2007, and the lowest - 0 in 2004. The data has a constant trend.
The average number of deaths per 1,000 fires is 4. This indicator was the highest - 13 in 2017, and the lowest 0 in 2004. The trend for deaths per 1,000 incidents is decreasing. Compared to the Georgia value the number of deaths per 1,000 incidents is much higher.
 Based on the data from the years 2003 - 2018 the average number of fire-related yearly casualties is 2. The highest number of reported casualties - 4 took place in 2012, and the lowest - 0 in 2004. The data has an increasing trend.
The average number of casualties per 1,000 fire incidents is 8. This indicator was the highest - 19 in 2015, and the lowest 0 in 2004. The trend for injuries per 1,000 fire incidents is growing. Compared to the Georgia value the number of casualties per 1,000 incidents is similar.
Based on the data from the years 2003 - 2018 the average number of fire-related yearly casualties is 2. The highest number of reported casualties - 4 took place in 2012, and the lowest - 0 in 2004. The data has an increasing trend.
The average number of casualties per 1,000 fire incidents is 8. This indicator was the highest - 19 in 2015, and the lowest 0 in 2004. The trend for injuries per 1,000 fire incidents is growing. Compared to the Georgia value the number of casualties per 1,000 incidents is similar.Casualties per 1,000 incidents in Smyrna, GA compared to nearest cities:
(Note: Based on data for all years, including only cities with at least 500 fire incidents)
| Smyrna: | 9.5 |
| Mableton: | 18.8 |
| Marietta: | 24.8 |
| Austell: | 19.8 |
| Powder Springs: | 14.3 |
| Lithia Springs: | 4.0 |
| Sandy Springs: | 7.1 |
| Atlanta: | 6.7 |
| Kennesaw: | 11.0 |
 27.2% incidents where reported in the morning and 72.8% in the evening. The most fires (15.6%) took place on Friday, and the least (13.5%) on Tuesday.
 Based on the 2,533 incident reports from years 2003 - 2018 most fires (11.8%) took place during March, and the least (6.1%) in September.
 Out of all 37,832 cases reported during the years 2003 - 2018, the most belonged to the categories: Rescue & EMS (52.1%), Good Intent Call (14.5%), and Service Call (11.4%).
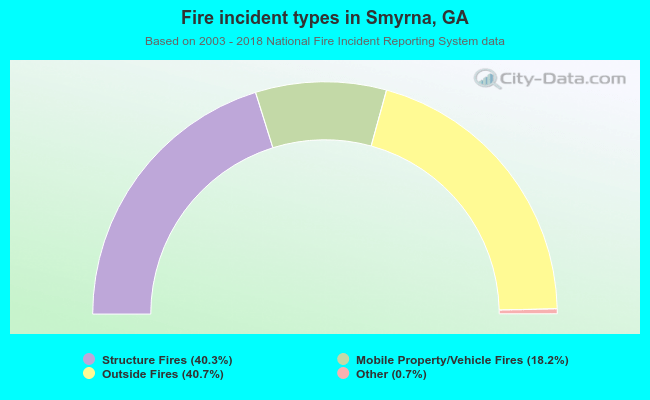 When looking into fire subcategories, the most incidents belonged to: Outside Fires (40.7%), and Structure Fires (40.3%).