Decatur: Fire Incidents, Georgia (GA)
Where are fire incidents reported in Decatur, GA
Something went wrong! Please refresh the page.
| Fire incidents reported | |
|---|---|
| Sreet name | Count |
| GLENWOOD RD | 556 |
| CANDLER RD | 396 |
| COLUMBIA DR | 330 |
| WESLEY CHAPEL RD | 294 |
| FLAT SHOALS PW | 260 |
| MEMORIAL DR | 254 |
| PANTHERSVILLE RD | 232 |
| FLAT SHOALS RD | 220 |
| 20 WB | 188 |
| 20 EB | 170 |
| SNAPFINGER WOODS DR | 150 |
| SNAPFINGER RD | 146 |
| COVINGTON HW | 140 |
| 285 SB | 124 |
| EMBER DR | 122 |
| 285 NB | 120 |
| PONCE DE LEON AVE | 118 |
| ATLANTA AVE | 114 |
| MOUNTAIN DR | 112 |
| CHURCH ST | 104 |
| MCAFEE RD | 104 |
| DECATUR RD | 102 |
| TRINITY PL | 102 |
| LAWRENCEVILLE HW | 92 |
| 285 EB | 84 |
| CLAIREMONT AVE | 84 |
| COLLEGE AVE | 84 |
| RAINBOW DR | 82 |
| WESLEY CLUB DR | 80 |
| COVINGTON HWY | 74 |
| Other | 3,364 |
2003 - 2018 National Fire Incident Reporting System (NFIRS) incidents
- Incident types reported to NFIRS in Decatur, GA
- 71,18758.6%Rescue & EMS
- 18,19915.0%Good Intent Call
- 8,5237.0%Hazardous Condition
- 8,4026.9%Fire
- 8,0176.6%Service Call
- 6,7685.6%False Alarm
- 2040.2%Special Incident
- 1360.1%Severe Weather
- Fire incident types reported to NFIRS in Decatur, GA
- 3,38840.3%Structure Fires
- 2,62631.3%Outside Fires
- 2,12025.2%Mobile Property/Vehicle Fires
- 2683.2%Other
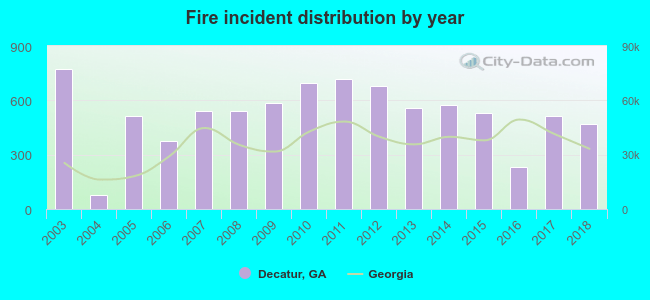 According to the data from the years 2003 - 2018 the average number of fires per year is 524. The highest number of fire incidents - 774 took place in 2003, and the least - 80 in 2004. The data has a dropping trend.
The average number of yearly fire incidents per 10k residents in Decatur, GA compared to nearest cities:
(Note: Based on data for the last 3 years, including only cities with population 5,000 and above)
| Decatur: | 198.1 |
| Scottdale: | 11.0 |
| Clarkston: | 56.1 |
| Gresham Park: | 5.4 |
| Atlanta: | 36.1 |
| Tucker: | 29.4 |
| Stone Mountain: | 481.3 |
| Chamblee: | 34.8 |
| Doraville: | 21.8 |
 The median response time based on all reported fire incidents is 5 minutes. This is lower than the state median value.
The median response time in Decatur, GA compared to nearest cities:
(Note: Based on data for all years, including only cities with at least 500 fire incidents)
| Decatur: | 5 minutes |
| Clarkston: | 6 minutes |
| Atlanta: | 5 minutes |
| Tucker: | 6 minutes |
| Stone Mountain: | 6 minutes |
| Chamblee: | 7 minutes |
| Hapeville: | 3 minutes |
| East Point: | 6 minutes |
| Forest Park: | 6 minutes |
 Based on the data from the years 2003 - 2018 the average number of fire-related fatalities per year is 1. The highest number of deaths - 5 took place in 2014, and the lowest - 0 in 2004. The data has a rising trend.
The average number of deaths per 1,000 fires is 2. This indicator was the highest - 9 in 2014, and the lowest 0 in 2004. The trend for deaths per 1,000 incidents is increasing. Compared to the Georgia value the number of deaths per 1,000 incidents is similar.
Based on the data from the years 2003 - 2018 the average number of fire-related fatalities per year is 1. The highest number of deaths - 5 took place in 2014, and the lowest - 0 in 2004. The data has a rising trend.
The average number of deaths per 1,000 fires is 2. This indicator was the highest - 9 in 2014, and the lowest 0 in 2004. The trend for deaths per 1,000 incidents is increasing. Compared to the Georgia value the number of deaths per 1,000 incidents is similar.Deaths per 1,000 incidents in Decatur, GA compared to nearest cities:
(Note: Based on data for all years, including only cities with at least 2,500 fire incidents)
| Decatur: | 2.1 |
| Atlanta: | 3.1 |
| Stone Mountain: | 2.3 |
| Lithonia: | 1.6 |
| College Park: | 1.9 |
| Norcross: | 2.6 |
| Smyrna: | 4.7 |
| Riverdale: | 1.0 |
| Stockbridge: | 2.3 |
 According to the data from the years 2003 - 2018 the average number of fire-related casualties per year is 3. The highest number of injuries - 8 took place in 2003, and the lowest - 0 in 2012. The data has a dropping trend.
The average number of injuries per 1,000 fire incidents is 7. This indicator was the highest - 15 in 2015, and the lowest 0 in 2012. The trend for injuries per 1,000 fires is declining. Compared to the Georgia value the number of casualties per 1,000 incidents is lower.
According to the data from the years 2003 - 2018 the average number of fire-related casualties per year is 3. The highest number of injuries - 8 took place in 2003, and the lowest - 0 in 2012. The data has a dropping trend.
The average number of injuries per 1,000 fire incidents is 7. This indicator was the highest - 15 in 2015, and the lowest 0 in 2012. The trend for injuries per 1,000 fires is declining. Compared to the Georgia value the number of casualties per 1,000 incidents is lower.Casualties per 1,000 incidents in Decatur, GA compared to nearest cities:
(Note: Based on data for all years, including only cities with at least 500 fire incidents)
| Decatur: | 6.4 |
| Clarkston: | 4.1 |
| Atlanta: | 6.7 |
| Tucker: | 7.3 |
| Stone Mountain: | 6.5 |
| Chamblee: | 3.5 |
| Hapeville: | 0.0 |
| East Point: | 9.2 |
| Forest Park: | 36.9 |
 31.2% incidents where reported in the morning and 68.8% in the evening. The most fires (15.9%) took place on Saturday, and the least (13.3%) on Thursday.
 Based on the 8,402 incident reports from years 2003 - 2018 most fires (10.2%) took place during April, and the least (6.8%) in August.
 Out of all 121,525 cases reported during the years 2003 - 2018, the most belonged to the categories: Rescue & EMS (58.6%), Good Intent Call (15.0%), and Hazardous Condition (7.0%).
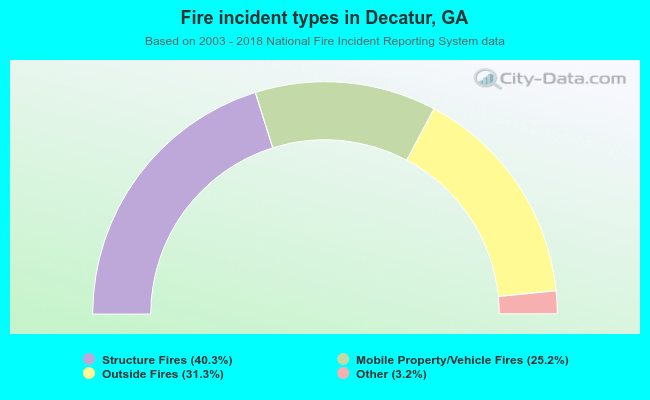 When looking into fire subcategories, the most reports belonged to: Structure Fires (40.3%), and Outside Fires (31.3%).