Stone Mountain: Fire Incidents, Georgia (GA)
Where are fire incidents reported in Stone Mountain, GA
Something went wrong! Please refresh the page.
| Fire incidents reported | |
|---|---|
| Sreet name | Count |
| MEMORIAL DR | 526 |
| ROCKBRIDGE RD | 482 |
| HAIRSTON RD | 418 |
| COVINGTON HW | 344 |
| REDAN RD | 230 |
| CENTRAL DR | 226 |
| STONE MTN LITHONIA RD | 158 |
| MOUNTAIN ST | 152 |
| OLD HIGHWAY 78 EAST | 118 |
| PANOLA RD | 94 |
| STONE MOUNTAIN HWY | 94 |
| TREE MOUNTAIN PW | 90 |
| INDIAN CREEK DR | 88 |
| TREEHILLS PW | 78 |
| STEPHENSON RD | 76 |
| 285 NB | 70 |
| DESHON RD | 70 |
| HAMBRICK RD | 64 |
| SUMMIT LAKE DR | 62 |
| CHATFIELD DR | 58 |
| PONCE DE LEON AV | 56 |
| WOOD BEND DR | 54 |
| HWY 78 WB | 50 |
| ROWLAND RD | 50 |
| MARTIN RD | 48 |
| BELVEDERE SQ | 46 |
| LESLIE OAKS DR | 46 |
| OLD HIGHWAY 78 WEST | 46 |
| KENSINGTON RD | 44 |
| STONEWALL JACKSON DR | 44 |
| Other | 2,452 |
2003 - 2018 National Fire Incident Reporting System (NFIRS) incidents
- Incident types reported to NFIRS in Stone Mountain, GA
- 36,98755.2%Rescue & EMS
- 10,25915.3%Good Intent Call
- 6,4349.6%Fire
- 5,1607.7%Hazardous Condition
- 4,5836.8%Service Call
- 3,3825.0%False Alarm
- 1200.2%Severe Weather
- Fire incident types reported to NFIRS in Stone Mountain, GA
- 2,87644.7%Structure Fires
- 2,22634.6%Outside Fires
- 1,21718.9%Mobile Property/Vehicle Fires
- 1151.8%Other
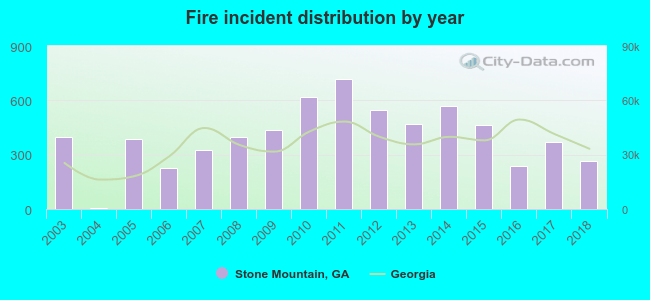 According to the data from the years 2003 - 2018 the average number of fire incidents per year is 402. The highest number of reported fire incidents - 716 took place in 2011, and the least - 7 in 2004. The data has a dropping trend.
The average number of yearly fire incidents per 10k residents in Stone Mountain, GA compared to nearest cities:
(Note: Based on data for the last 3 years, including only cities with population 5,000 and above)
| Stone Mountain: | 481.3 |
| Clarkston: | 56.1 |
| Tucker: | 29.4 |
| Scottdale: | 11.0 |
| Lilburn: | 85.8 |
| Decatur: | 198.1 |
| Doraville: | 21.8 |
| Norcross: | 137.6 |
| Chamblee: | 34.8 |
 The median response time based on all reported fire incidents is 6 minutes. This is about the same as the Georgia median value.
The median response time in Stone Mountain, GA compared to nearest cities:
(Note: Based on data for all years, including only cities with at least 500 fire incidents)
| Stone Mountain: | 6 minutes |
| Clarkston: | 6 minutes |
| Tucker: | 6 minutes |
| Lilburn: | 7 minutes |
| Lithonia: | 7 minutes |
| Decatur: | 5 minutes |
| Norcross: | 7 minutes |
| Chamblee: | 7 minutes |
| Snellville: | 8 minutes |
 According to the reports from the years 2003 - 2018 the average number of fire-related fatalities per year is 1. The highest number of reported deaths - 4 took place in 2005, and the lowest - 0 in 2003. The data has a growing trend.
The average number of deaths per 1,000 fires is 2. This indicator was the highest - 10 in 2005, and the lowest 0 in 2003. The trend for deaths per 1,000 fires is increasing. Compared to the state value the number of fatalities per 1,000 fire incidents is similar.
According to the reports from the years 2003 - 2018 the average number of fire-related fatalities per year is 1. The highest number of reported deaths - 4 took place in 2005, and the lowest - 0 in 2003. The data has a growing trend.
The average number of deaths per 1,000 fires is 2. This indicator was the highest - 10 in 2005, and the lowest 0 in 2003. The trend for deaths per 1,000 fires is increasing. Compared to the state value the number of fatalities per 1,000 fire incidents is similar.Deaths per 1,000 incidents in Stone Mountain, GA compared to nearest cities:
(Note: Based on data for all years, including only cities with at least 2,500 fire incidents)
| Stone Mountain: | 2.3 |
| Lithonia: | 1.6 |
| Decatur: | 2.1 |
| Norcross: | 2.6 |
| Conyers: | 3.2 |
| Atlanta: | 3.1 |
| Lawrenceville: | 2.5 |
| Loganville: | 1.2 |
| Roswell: | 1.2 |
 Based on the data from the years 2003 - 2018 the average number of fire-related yearly casualties is 3. The highest number of injuries - 6 took place in 2013, and the lowest - 0 in 2003. The data has a growing trend.
The average number of injuries per 1,000 fires is 6. This indicator was the highest - 19 in 2018, and the lowest 0 in 2003. The trend for casualties per 1,000 fires is rising. Compared to the Georgia value the number of casualties per 1,000 fires is lower.
Based on the data from the years 2003 - 2018 the average number of fire-related yearly casualties is 3. The highest number of injuries - 6 took place in 2013, and the lowest - 0 in 2003. The data has a growing trend.
The average number of injuries per 1,000 fires is 6. This indicator was the highest - 19 in 2018, and the lowest 0 in 2003. The trend for casualties per 1,000 fires is rising. Compared to the Georgia value the number of casualties per 1,000 fires is lower.
 29.2% incidents where reported in the morning and 70.8% in the evening. The most fires (16.1%) took place on Sunday, and the least (12.9%) on Wednesday.
 According to the 6,434 incident reports from years 2003 - 2018 most fires (10.1%) took place during March, and the least (6.9%) in September.
 Out of all 67,016 cases reported during the years 2003 - 2018, the most belonged to the categories: Rescue & EMS (55.2%), Good Intent Call (15.3%), and Fire (9.6%).
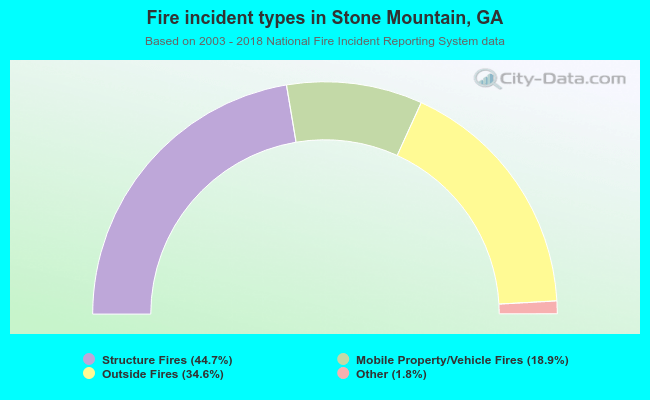 When looking into fire subcategories, the most incidents belonged to: Structure Fires (44.7%), and Outside Fires (34.6%).