Wauconda: Fire Incidents, Illinois (IL)
Where are fire incidents reported in Wauconda, IL
Something went wrong! Please refresh the page.
| Fire incidents reported | |
|---|---|
| Sreet name | Count |
| MAIN ST | 154 |
| RAND ROAD (ROUTE 12) | 102 |
| LIBERTY STREET (RT 176) | 90 |
| SLOCUM LAKE RD | 62 |
| GARLAND RD | 52 |
| LARKDALE ROW | 46 |
| MILTON RD | 42 |
| BONNER RD | 40 |
| LIBERTY STREETRT 176 | 38 |
| BARRINGTON RD | 36 |
| OLD RAND RD | 34 |
| BROWN ST | 32 |
| CALLAHAN RD | 30 |
| MAPLE AVE | 30 |
| RAND ROADROUTE 12 | 30 |
| DARRELL RD | 28 |
| FAIRFIELD RD | 24 |
| FOREST GARDEN RD | 22 |
| GOSSELL RD | 22 |
| OLD COUNTRY WAY | 22 |
| ROUTE 176 | 22 |
| GILMER RD | 20 |
| MILL ST | 20 |
| OSAGE ST | 20 |
| ROUTE 12 | 20 |
| IVANHOE RD | 18 |
| TAMARACK DR | 18 |
| WILLOW RD | 18 |
| MAY ST | 16 |
| WILSON AVE | 16 |
| Other | 152 |
2002 - 2018 National Fire Incident Reporting System (NFIRS) incidents
- Incident types reported to NFIRS in Wauconda, IL
- 7,32652.7%Rescue & EMS
- 1,60311.5%Hazardous Condition
- 1,54011.1%Service Call
- 1,2769.2%Fire
- 1,2499.0%False Alarm
- 8666.2%Good Intent Call
- 180.1%Overpressure Rupture
- 170.1%Special Incident
- Fire incident types reported to NFIRS in Wauconda, IL
- 62749.1%Structure Fires
- 47136.9%Outside Fires
- 15111.8%Mobile Property/Vehicle Fires
- 272.1%Other
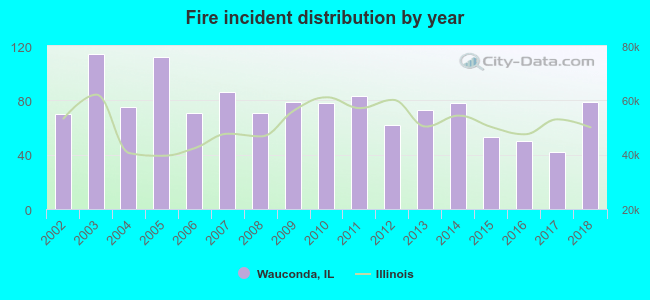 Based on the data from the years 2002 - 2018 the average number of fires per year is 75. The highest number of reported fires - 114 took place in 2003, and the least - 42 in 2017. The data has a rising trend.
The average number of yearly fire incidents per 10k residents in Wauconda, IL compared to nearest cities:
(Note: Based on data for the last 3 years, including only cities with population 5,000 and above)
| Wauconda: | 41.0 |
| Island Lake: | 28.6 |
| Hawthorn Woods: | 20.7 |
| Lakemoor: | 28.3 |
| Lake Zurich: | 28.1 |
| Round Lake Park: | 11.3 |
| Round Lake: | 33.3 |
| Cary: | 25.9 |
| Mundelein: | 26.3 |
 The median response time based on all reported fire incidents is 6 minutes. This is about the same as the state median value.
The median response time in Wauconda, IL compared to nearest cities:
(Note: Based on data for all years, including only cities with at least 500 fire incidents)
| Wauconda: | 6 minutes |
| Lake Zurich: | 8 minutes |
| Round Lake: | 5 minutes |
| Cary: | 5 minutes |
| Mundelein: | 5 minutes |
| Barrington: | 7 minutes |
| Grayslake: | 6 minutes |
| Round Lake Beach: | 4 minutes |
| Long Grove: | 7 minutes |
 Based on the reports from the years 2002 - 2018 the average number of fire-related yearly casualties is 1. The highest number of reported casualties - 4 took place in 2002, and the lowest - 0 in 2003. The data has a dropping trend.
The average number of injuries per 1,000 fires is 7. This indicator was the highest - 57 in 2002, and the lowest 0 in 2003. The trend for casualties per 1,000 fire incidents is declining. Compared to the Illinois value the number of injuries per 1,000 fires is lower.
Based on the reports from the years 2002 - 2018 the average number of fire-related yearly casualties is 1. The highest number of reported casualties - 4 took place in 2002, and the lowest - 0 in 2003. The data has a dropping trend.
The average number of injuries per 1,000 fires is 7. This indicator was the highest - 57 in 2002, and the lowest 0 in 2003. The trend for casualties per 1,000 fire incidents is declining. Compared to the Illinois value the number of injuries per 1,000 fires is lower.Casualties per 1,000 incidents in Wauconda, IL compared to nearest cities:
(Note: Based on data for all years, including only cities with at least 500 fire incidents)
| Wauconda: | 7.1 |
| Lake Zurich: | 23.2 |
| Round Lake: | 14.2 |
| Cary: | 1.4 |
| Mundelein: | 10.6 |
| Barrington: | 5.8 |
| Grayslake: | 15.9 |
| Round Lake Beach: | 21.8 |
| Long Grove: | 45.5 |
 34.9% incidents where reported in the morning and 65.1% in the evening. The most fires (18.9%) took place on Saturday, and the least (11.6%) on Wednesday.
 Based on the 1,276 reports from years 2002 - 2018 most fires (12.8%) took place during April, and the least (6.4%) in October.
 Out of all 13,897 cases reported during the years 2002 - 2018, the most belonged to the categories: Rescue & EMS (52.7%), Hazardous Condition (11.5%), and Service Call (11.1%).
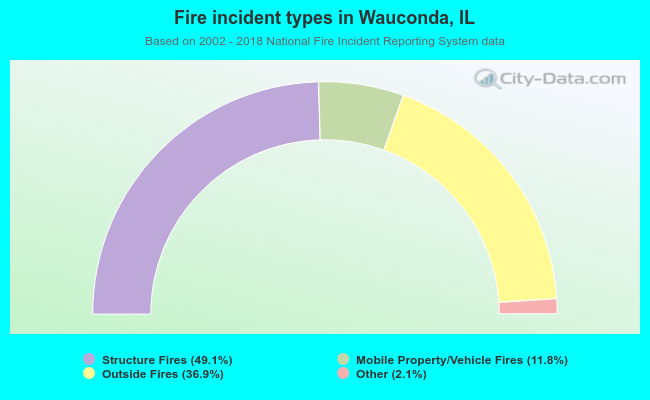 When looking into fire subcategories, the most reports belonged to: Structure Fires (49.1%), and Outside Fires (36.9%).