Hawthorn Woods: Fire Incidents, Illinois (IL)
Where are fire incidents reported in Hawthorn Woods, IL
Something went wrong! Please refresh the page.
|
| |||||||||||||||||||||||||||||||||||||||||||||||||||||||||||||||||||||||||||||||||||||||||||||||||||||||||||||
2002 - 2018 National Fire Incident Reporting System (NFIRS) incidents
- Incident types reported to NFIRS in Hawthorn Woods, IL
- 1,43850.9%Rescue & EMS
- 36613.0%Service Call
- 31611.2%False Alarm
- 2789.8%Fire
- 2639.3%Hazardous Condition
- 1535.4%Good Intent Call
- 80.3%Severe Weather
- 40.1%Overpressure Rupture
- Fire incident types reported to NFIRS in Hawthorn Woods, IL
- 15656.1%Structure Fires
- 9835.3%Outside Fires
- 196.8%Mobile Property/Vehicle Fires
- 51.8%Other
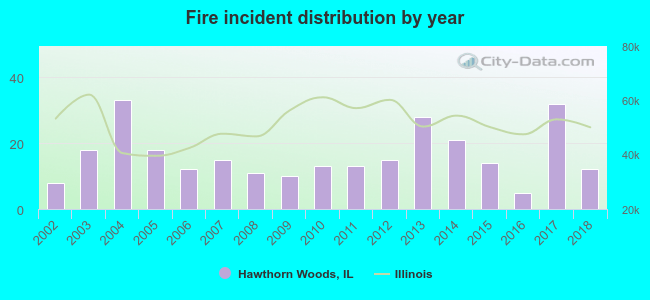 According to the data from the years 2002 - 2018 the average number of fires per year is 16. The highest number of reported fires - 33 took place in 2004, and the least - 5 in 2016. The data has a rising trend.
The average number of yearly fire incidents per 10k residents in Hawthorn Woods, IL compared to nearest cities:
(Note: Based on data for the last 3 years, including only cities with population 5,000 and above)
| Hawthorn Woods: | 20.7 |
| Lake Zurich: | 28.1 |
| Long Grove: | 40.7 |
| Mundelein: | 26.3 |
| Vernon Hills: | 18.4 |
| Wauconda: | 41.0 |
| Libertyville: | 43.1 |
| Buffalo Grove: | 20.4 |
| Barrington: | 52.1 |

 32.0% incidents where reported in the morning and 68.0% in the evening. The most fires (33.8%) took place on Saturday, and the least (8.6%) on Tuesday.
 According to the 278 fire incident reports from years 2002 - 2018 most fires (15.8%) took place during April, and the least (1.8%) in February.
 Out of all 2,826 cases reported during the years 2002 - 2018, the most belonged to the categories: Rescue & EMS (50.9%), Service Call (13.0%), and False Alarm (11.2%).
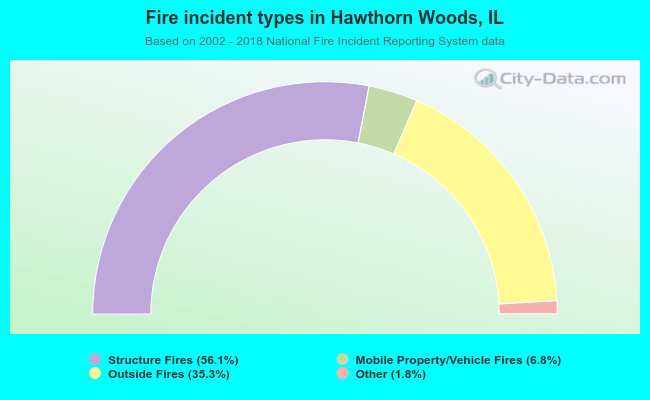 When looking into fire subcategories, the most reports belonged to: Structure Fires (56.1%), and Outside Fires (35.3%).