Barrington: Fire Incidents, Illinois (IL)
Where are fire incidents reported in Barrington, IL
Something went wrong! Please refresh the page.
| Fire incidents reported | |
|---|---|
| Sreet name | Count |
| NORTHWEST HWY | 108 |
| CUBA RD | 92 |
| HOUGH ST | 48 |
| RUSSELL ST | 40 |
| ALGONQUIN RD | 38 |
| MAIN ST | 32 |
| PENNY RD | 28 |
| GROVE AVE | 26 |
| BRINKER RD | 24 |
| NORTHWEST HIGHWAY | 22 |
| FLYNN CREEK DR | 20 |
| OTIS RD | 20 |
| BARRINGTON RD | 18 |
| COOK ST | 18 |
| COUNTY LINE RD | 18 |
| HILLSIDE AVE | 18 |
| KELSEY RD | 18 |
| PEPPER RD | 18 |
| RT22 | 18 |
| DUNDEE RD | 16 |
| HAGER AVE | 16 |
| OAKWOOD DR | 16 |
| PARK DR | 16 |
| ROLLING HILLS DR | 16 |
| CLASSIC CT | 14 |
| ELA RD | 14 |
| LAGESCHULTE ST | 14 |
| NORTHWEST R14 HWY | 14 |
| OLD SUTTON RD | 14 |
| WALTON ST | 14 |
| Other | 410 |
2002 - 2018 National Fire Incident Reporting System (NFIRS) incidents
- Incident types reported to NFIRS in Barrington, IL
- 6,34345.7%Rescue & EMS
- 1,99714.4%Hazardous Condition
- 1,71612.4%False Alarm
- 1,66812.0%Good Intent Call
- 1,1988.6%Fire
- 9316.7%Service Call
- Fire incident types reported to NFIRS in Barrington, IL
- 73161.0%Structure Fires
- 35729.8%Outside Fires
- 937.8%Mobile Property/Vehicle Fires
- 171.4%Other
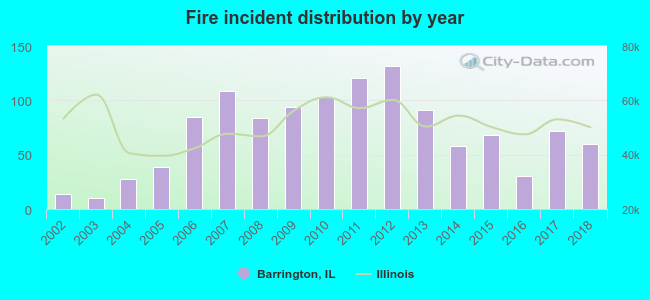 According to the data from the years 2002 - 2018 the average number of fire incidents per year is 70. The highest number of reported fires - 132 took place in 2012, and the least - 10 in 2003. The data has a rising trend.
The average number of yearly fire incidents per 10k residents in Barrington, IL compared to nearest cities:
(Note: Based on data for the last 3 years, including only cities with population 5,000 and above)
| Barrington: | 52.1 |
| Inverness: | 18.9 |
| Lake Zurich: | 28.1 |
| Palatine: | 20.6 |
| Hoffman Estates: | 20.1 |
| Hawthorn Woods: | 20.7 |
| Cary: | 25.9 |
| Long Grove: | 40.7 |
| Rolling Meadows: | 23.9 |
 The median response time based on all reported fire incidents is 7 minutes. This is higher compared to the state median value.
The median response time in Barrington, IL compared to nearest cities:
(Note: Based on data for all years, including only cities with at least 500 fire incidents)
| Barrington: | 7 minutes |
| Lake Zurich: | 8 minutes |
| Palatine: | 5 minutes |
| Hoffman Estates: | 5 minutes |
| Cary: | 5 minutes |
| Long Grove: | 7 minutes |
| Rolling Meadows: | 5 minutes |
| Carpentersville: | 5 minutes |
| Wauconda: | 6 minutes |
 According to the reports from the years 2002 - 2018 the average number of fire-related yearly casualties is 0. The highest number of injuries - 2 took place in 2010, and the lowest - 0 in 2002. The data has a constant trend.
The average number of injuries per 1,000 fire incidents is 4. This indicator was the highest - 19 in 2010, and the lowest 0 in 2002. The trend for injuries per 1,000 fire incidents is constant. Compared to the Illinois value the number of casualties per 1,000 fires is lower.
According to the reports from the years 2002 - 2018 the average number of fire-related yearly casualties is 0. The highest number of injuries - 2 took place in 2010, and the lowest - 0 in 2002. The data has a constant trend.
The average number of injuries per 1,000 fire incidents is 4. This indicator was the highest - 19 in 2010, and the lowest 0 in 2002. The trend for injuries per 1,000 fire incidents is constant. Compared to the Illinois value the number of casualties per 1,000 fires is lower.Casualties per 1,000 incidents in Barrington, IL compared to nearest cities:
(Note: Based on data for all years, including only cities with at least 500 fire incidents)
| Barrington: | 5.8 |
| Lake Zurich: | 23.2 |
| Palatine: | 16.4 |
| Hoffman Estates: | 23.6 |
| Cary: | 1.4 |
| Long Grove: | 45.5 |
| Rolling Meadows: | 19.4 |
| Carpentersville: | 13.6 |
| Wauconda: | 7.1 |
 31.8% incidents where reported in the morning and 68.2% in the evening. The most fires (18.9%) took place on Tuesday, and the least (11.9%) on Thursday.
 According to the 1,198 incident reports from years 2002 - 2018 most fires (13.6%) took place during April, and the least (4.8%) in June.
 Out of all 13,874 cases reported during the years 2002 - 2018, the most belonged to the categories: Rescue & EMS (45.7%), Hazardous Condition (14.4%), and False Alarm (12.4%).
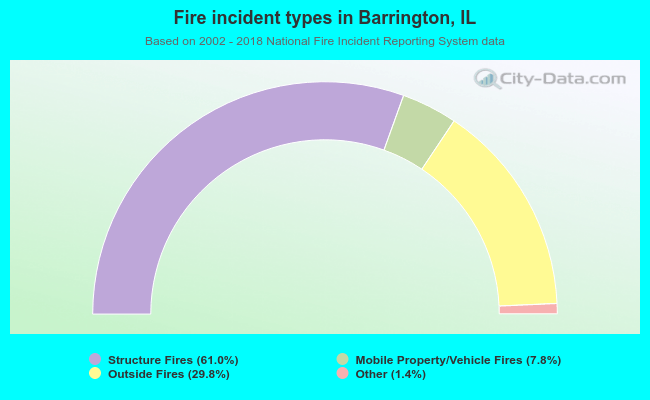 When looking into fire subcategories, the most reports belonged to: Structure Fires (61.0%), and Outside Fires (29.8%).