Island Lake: Fire Incidents, Illinois (IL)
Where are fire incidents reported in Island Lake, IL
Something went wrong! Please refresh the page.
|
| |||||||||||||||||||||||||||||||||||||||||||||||||||||||||||||||||||||||||||||||||||||||||||||||||||||||||||||
2002 - 2018 National Fire Incident Reporting System (NFIRS) incidents
- Incident types reported to NFIRS in Island Lake, IL
- 2,82357.5%Rescue & EMS
- 61412.5%Hazardous Condition
- 4609.4%Service Call
- 4368.9%Fire
- 3336.8%False Alarm
- 2324.7%Good Intent Call
- 60.1%Overpressure Rupture
- Fire incident types reported to NFIRS in Island Lake, IL
- 21148.4%Structure Fires
- 15435.3%Outside Fires
- 5512.6%Mobile Property/Vehicle Fires
- 163.7%Other
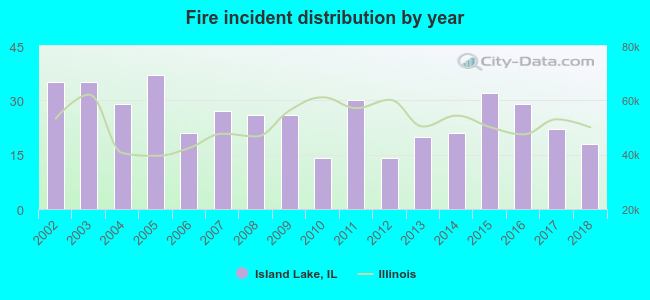 According to the data from the years 2002 - 2018 the average number of fire incidents per year is 26. The highest number of reported fire incidents - 37 took place in 2005, and the least - 14 in 2010. The data has a declining trend.
The average number of yearly fire incidents per 10k residents in Island Lake, IL compared to nearest cities:
(Note: Based on data for the last 3 years, including only cities with population 5,000 and above)
| Island Lake: | 28.6 |
| Wauconda: | 41.0 |
| Lakemoor: | 28.3 |
| Cary: | 25.9 |
| McHenry: | 43.8 |
| Round Lake: | 33.3 |
| Johnsburg: | 24.4 |
| Round Lake Park: | 11.3 |
| Crystal Lake: | 24.9 |

 According to the data from the years 2002 - 2018 the average number of fire-related casualties per year is 0. The highest number of injuries - 1 took place in 2006, and the lowest - 0 in 2002. The data has a constant trend.
 31.7% incidents where reported in the morning and 68.3% in the evening. The most fires (21.3%) took place on Sunday, and the least (10.3%) on Wednesday.
 According to the 436 incident reports from years 2002 - 2018 most fires (11.5%) took place during July, and the least (5.7%) in January.
 Out of all 4,906 cases reported during the years 2002 - 2018, the most belonged to the categories: Rescue & EMS (57.5%), Hazardous Condition (12.5%), and Service Call (9.4%).
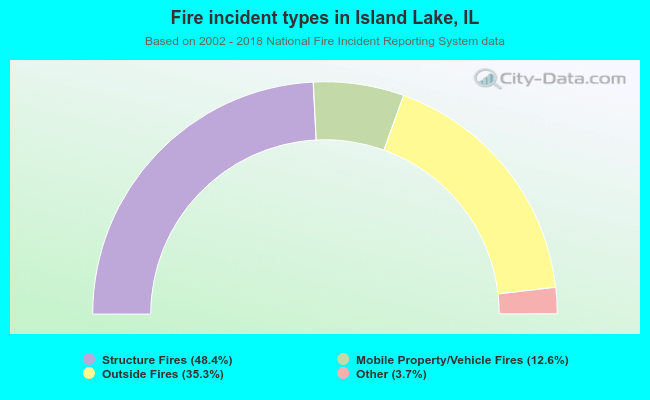 When looking into fire subcategories, the most reports belonged to: Structure Fires (48.4%), and Outside Fires (35.3%).