Watertown: Fire Incidents, Connecticut (CT)
Where are fire incidents reported in Watertown, CT
Something went wrong! Please refresh the page.
| Fire incidents reported | |
|---|---|
| Sreet name | Count |
| MAIN ST | 74 |
| BUCKINGHAM ST | 46 |
| FRENCH ST | 44 |
| STRAITS TURNPIKE | 44 |
| WOODBURY RD | 44 |
| BUNKER HILL RD | 38 |
| ECHO LAKE RD | 38 |
| LITCHFIELD RD | 30 |
| MAIN ST | 28 |
| PARK RD | 28 |
| CHERRY AVE | 20 |
| ECHO LAKE RD | 20 |
| STRAITS | 20 |
| FRANSON RD | 18 |
| HAMILTON AVE | 18 |
| GUERNSEYTOWN RD | 16 |
| MIDDLEBURY RD | 16 |
| ROUTE 8 | 16 |
| WOODBURY RD | 16 |
| ECHO LAKE EXT RD | 14 |
| LITCHFIELD RD | 14 |
| MCDONNELL RD | 14 |
| MOUNT FAIR DRIVE | 14 |
| NOVA SCOTIA HILL RD | 14 |
| BUNKER HILL RD | 12 |
| GEORGETOWN DRIVE | 12 |
| NORTHFIELD RD | 12 |
| NORTHFIELD RD | 12 |
| ROUTE 8 SOUTH | 12 |
| SCOTT AVE | 12 |
| Other | 188 |
2002 - 2018 National Fire Incident Reporting System (NFIRS) incidents
- Incident types reported to NFIRS in Watertown, CT
- 6,55064.8%Rescue & EMS
- 1,14211.3%Hazardous Condition
- 9989.9%False Alarm
- 9048.9%Fire
- 3053.0%Good Intent Call
- 1521.5%Service Call
- 410.4%Severe Weather
- Fire incident types reported to NFIRS in Watertown, CT
- 51256.6%Structure Fires
- 27130.0%Outside Fires
- 10011.1%Mobile Property/Vehicle Fires
- 212.3%Other
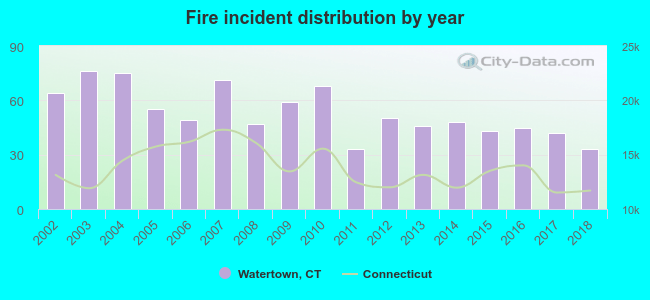 According to the data from the years 2002 - 2018 the average number of fires per year is 53. The highest number of reported fires - 76 took place in 2003, and the least - 33 in 2011. The data has a decreasing trend.
The average number of yearly fire incidents per 10k residents in Watertown, CT compared to nearest cities:
(Note: Based on data for the last 3 years, including only cities with population 5,000 and above)
| Watertown: | 17.8 |
| Oakville: | 21.0 |
| Waterbury: | 51.4 |
| Middlebury: | 29.0 |
| Thomaston: | 23.2 |
| Woodbury: | 18.4 |
| Wolcott: | 22.2 |
| Plymouth: | 3.7 |
| Terryville: | 26.0 |
 The median response time based on all reported fire incidents is 3 minutes. This is lower compared to the Connecticut median value.
The median response time in Watertown, CT compared to nearest cities:
(Note: Based on data for all years, including only cities with at least 500 fire incidents)
| Watertown: | 3 minutes |
| Waterbury: | 4 minutes |
| Wolcott: | 5 minutes |
| Naugatuck: | 4 minutes |
| Bristol: | 4 minutes |
| Southbury: | 5 minutes |
| Harwinton: | 7 minutes |
| Southington: | 6 minutes |
| Oxford: | 6 minutes |
 According to the data from the years 2002 - 2018 the average number of fire-related yearly casualties is 1. The highest number of injuries - 2 took place in 2010, and the lowest - 0 in 2002. The data has a constant trend.
The average number of casualties per 1,000 fire incidents is 11. This indicator was the highest - 48 in 2017, and the lowest 0 in 2002. The trend for casualties per 1,000 fire incidents is constant. Compared to the Connecticut value the number of injuries per 1,000 fire incidents is lower.
According to the data from the years 2002 - 2018 the average number of fire-related yearly casualties is 1. The highest number of injuries - 2 took place in 2010, and the lowest - 0 in 2002. The data has a constant trend.
The average number of casualties per 1,000 fire incidents is 11. This indicator was the highest - 48 in 2017, and the lowest 0 in 2002. The trend for casualties per 1,000 fire incidents is constant. Compared to the Connecticut value the number of injuries per 1,000 fire incidents is lower.
 29.2% incidents where reported in the morning and 70.8% in the evening. The most fires (15.3%) took place on Sunday, and the least (12.9%) on Saturday.
 According to the 904 fire incidents from years 2002 - 2018 most fires (12.8%) took place during April, and the least (6.4%) in July.
 Out of all 10,101 cases reported during the years 2002 - 2018, the most belonged to the categories: Rescue & EMS (64.8%), Hazardous Condition (11.3%), and False Alarm (9.9%).
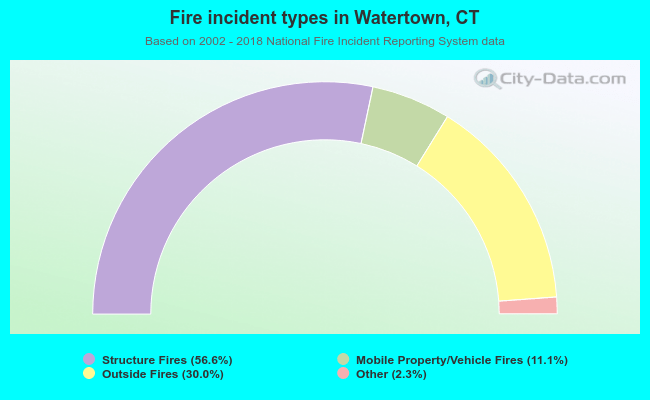 When looking into fire subcategories, the most incidents belonged to: Structure Fires (56.6%), and Outside Fires (30.0%).