Southbury: Fire Incidents, Connecticut (CT)
Where are fire incidents reported in Southbury, CT
Something went wrong! Please refresh the page.
| Fire incidents reported | |
|---|---|
| Sreet name | Count |
| HERITAGE VILLAGE | 204 |
| ROUTE 172 | 116 |
| I-84 | 100 |
| MAIN ST SOUTH | 100 |
| I84 | 82 |
| MAIN ST NORTH | 56 |
| BERKSHIRE RD | 50 |
| GEORGES HILL RD | 48 |
| ROXBURY RD | 48 |
| FISH ROCK RD | 30 |
| HERITAGE RD | 30 |
| BUCKS HILL RD | 28 |
| KETTLETOWN RD | 28 |
| OLD FIELD RD | 28 |
| OLD WATERBURY RD | 28 |
| SOUTH BRITAIN RD | 28 |
| SOUTHFORD RD | 26 |
| POVERTY RD | 20 |
| RIVER RD | 20 |
| SCOUT RD | 20 |
| STRONGTOWN RD | 20 |
| JEREMY SWAMP RD | 18 |
| MAIN STREET SOUTH | 18 |
| PURCHASE BROOK RD | 18 |
| BULLET HILL RD | 16 |
| BURR RD | 16 |
| HULLS HILL RD | 14 |
| JACOB RD | 14 |
| FLOOD BRIDGE RD | 12 |
| JUDD RD | 12 |
2002 - 2018 National Fire Incident Reporting System (NFIRS) incidents
- Incident types reported to NFIRS in Southbury, CT
- 2,14731.4%False Alarm
- 1,35219.8%Hazardous Condition
- 1,12516.4%Rescue & EMS
- 97914.3%Fire
- 71010.4%Good Intent Call
- 4456.5%Service Call
- 460.7%Severe Weather
- 300.4%Overpressure Rupture
- Fire incident types reported to NFIRS in Southbury, CT
- 44245.1%Structure Fires
- 27828.4%Outside Fires
- 23323.8%Mobile Property/Vehicle Fires
- 262.7%Other
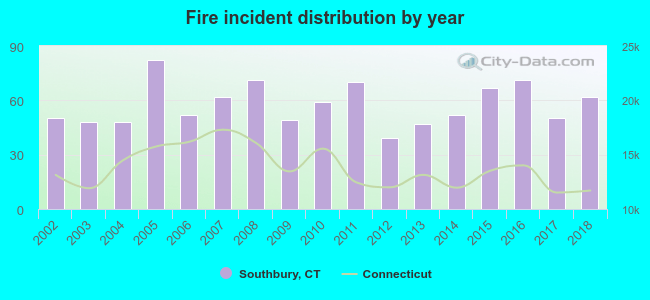 Based on the data from the years 2002 - 2018 the average number of fire incidents per year is 58. The highest number of fire incidents - 82 took place in 2005, and the least - 39 in 2012. The data has a rising trend.
The average number of yearly fire incidents per 10k residents in Southbury, CT compared to nearest cities:
(Note: Based on data for the last 3 years, including only cities with population 5,000 and above)
| Southbury: | 30.6 |
| Woodbury: | 18.4 |
| Oxford: | 26.3 |
| Riverside: | 18.6 |
| Middlebury: | 29.0 |
| Beacon Falls: | 40.8 |
| Brookfield: | 22.3 |
| Naugatuck: | 31.4 |
| Monroe: | 45.5 |
 The median response time based on all reported fire incidents is 5 minutes. This is close to the Connecticut median value.
The median response time in Southbury, CT compared to nearest cities:
(Note: Based on data for all years, including only cities with at least 500 fire incidents)
| Southbury: | 5 minutes |
| Oxford: | 6 minutes |
| Newtown: | 7 minutes |
| Brookfield: | 6 minutes |
| Naugatuck: | 4 minutes |
| Monroe: | 6 minutes |
| Seymour: | 5 minutes |
| Watertown: | 3 minutes |
| Waterbury: | 4 minutes |
 32.8% incidents where reported in the morning and 67.2% in the evening. The most fires (15.8%) took place on Monday, and the least (12.8%) on Tuesday.
 According to the 979 fire incident reports from years 2002 - 2018 most fires (10.4%) took place during April, and the least (5.6%) in September.
 Out of all 6,839 cases reported during the years 2002 - 2018, the most belonged to the categories: False Alarm (31.4%), Hazardous Condition (19.8%), and Rescue & EMS (16.4%).
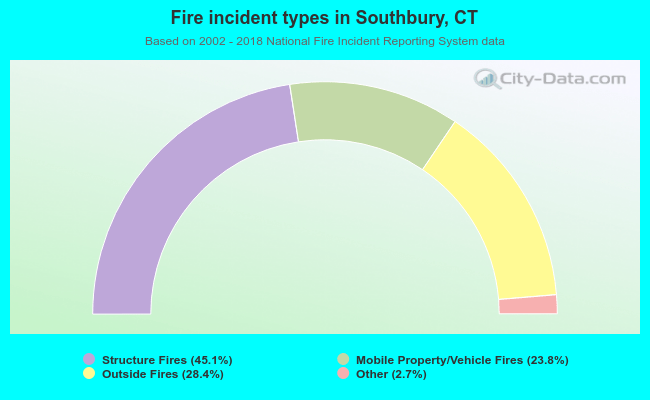 When looking into fire subcategories, the most incidents belonged to: Structure Fires (45.1%), and Outside Fires (28.4%).