Brookfield: Fire Incidents, Connecticut (CT)
Where are fire incidents reported in Brookfield, CT
Something went wrong! Please refresh the page.
| Fire incidents reported | |
|---|---|
| Sreet name | Count |
| FEDERAL RD | 268 |
| CANDLEWOOD LAKE RD | 88 |
| WHISCONIER RD | 80 |
| LONG MEADOW HILL RD | 50 |
| STONY HILL RD | 44 |
| GRAYS BRIDGE RD | 36 |
| VALE RD | 34 |
| HOMESTEAD LN | 28 |
| JUNCTION RD | 26 |
| OBTUSE ROAD SOUTH | 26 |
| POCONO RD | 26 |
| HUCKLEBERRY HILL RD | 24 |
| IRONWORKS HILL RD | 24 |
| KELLOGG ST | 24 |
| LAKE SHORE DR | 24 |
| OLD ROUTE 7 | 24 |
| ROUTE 7 | 20 |
| ELBOW HILL RD | 18 |
| LAUREL HILL RD | 18 |
| LONGVIEW DR | 18 |
| SILVERMINE RD | 16 |
| FLAX HILL RD | 14 |
| OLD NEW MILFORD RD | 14 |
| RIVERFORD RD | 14 |
| SECOR RD | 14 |
| DEAN RD | 12 |
| TOWER RD | 12 |
| CARMEN HILL RD | 10 |
| FARVIEW RD | 10 |
| HEARTHSTONE DR | 10 |
2002 - 2018 National Fire Incident Reporting System (NFIRS) incidents
- Incident types reported to NFIRS in Brookfield, CT
- 1,01427.1%Fire
- 89824.0%False Alarm
- 72819.4%Hazardous Condition
- 43711.7%Rescue & EMS
- 2967.9%Good Intent Call
- 2536.8%Service Call
- 742.0%Overpressure Rupture
- 441.2%Severe Weather
- Fire incident types reported to NFIRS in Brookfield, CT
- 35735.2%Other
- 33533.0%Structure Fires
- 23823.5%Outside Fires
- 848.3%Mobile Property/Vehicle Fires
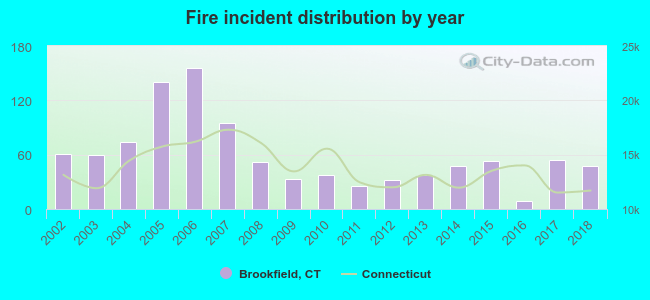 Based on the data from the years 2002 - 2018 the average number of fires per year is 60. The highest number of fires - 156 took place in 2006, and the least - 9 in 2016. The data has a declining trend.
The average number of yearly fire incidents per 10k residents in Brookfield, CT compared to nearest cities:
(Note: Based on data for the last 3 years, including only cities with population 5,000 and above)
| Brookfield: | 22.3 |
| New Fairfield: | 15.6 |
| Danbury: | 19.2 |
| Bethel: | 73.3 |
| New Milford: | 70.0 |
| Southbury: | 30.6 |
| Redding: | 19.3 |
| Woodbury: | 18.4 |
| Monroe: | 45.5 |
 The median response time based on all reported fire incidents is 6 minutes. This is close to the state median value.
The median response time in Brookfield, CT compared to nearest cities:
(Note: Based on data for all years, including only cities with at least 500 fire incidents)
| Brookfield: | 6 minutes |
| New Fairfield: | 7 minutes |
| Danbury: | 5 minutes |
| Newtown: | 7 minutes |
| Bethel: | 6 minutes |
| New Milford: | 7 minutes |
| Southbury: | 5 minutes |
| Redding: | 7 minutes |
| Monroe: | 6 minutes |
 31.9% incidents where reported in the morning and 68.1% in the evening. The most fires (15.4%) took place on Sunday, and the least (12.8%) on Monday.
 Based on the 1,014 fire incidents from years 2002 - 2018 most fires (11.1%) took place during April, and the least (4.3%) in September.
 Out of all 3,745 cases reported during the years 2002 - 2018, the most belonged to the categories: Fire (27.1%), False Alarm (24.0%), and Hazardous Condition (19.4%).
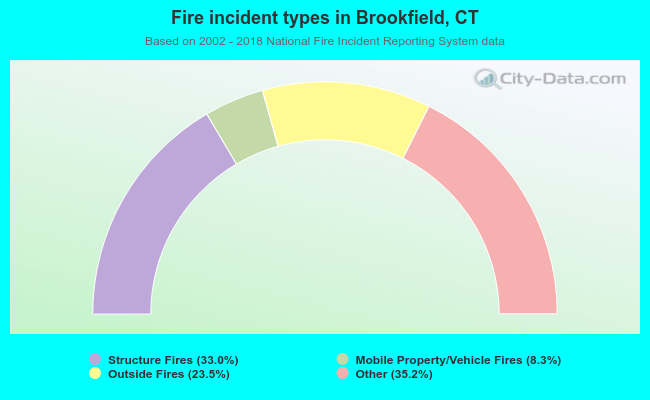 When looking into fire subcategories, the most incidents belonged to: Other (35.2%), and Structure Fires (33.0%).