Warwick: Fire Incidents, Rhode Island (RI)
Where are fire incidents reported in Warwick, RI
Something went wrong! Please refresh the page.
| Fire incidents reported | |
|---|---|
| Sreet name | Count |
| POST RD | 176 |
| BALD HILL RD | 94 |
| WEST SHORE RD | 78 |
| WARWICK AV | 74 |
| JEFFERSON BLVD | 56 |
| QUAKER LN | 56 |
| SANDY LN | 50 |
| GREENWICH AV | 46 |
| CENTERVILLE RD | 32 |
| EAST AV | 28 |
| LAMBERT LIND HWY | 26 |
| TOLLGATE RD | 26 |
| ASYLUM RD | 20 |
| WARWICK AVE | 20 |
| COWESETT RD | 18 |
| AIRPORT RD | 16 |
| GREENWICH AVE | 14 |
| CEDAR POND DR | 12 |
| EAST AVE | 12 |
| NARRAGANSETT PKWY | 12 |
| SAMUEL GORTON AV | 12 |
| WYOMING AV | 12 |
| CHESTNUT ST | 10 |
| ELMWOOD AV | 10 |
| OAKLAND BEACH AV | 10 |
| UNIVERSAL BLVD | 10 |
| ARNOLDS NECK DR | 8 |
| BLACKBURN ST | 8 |
| BUTTONWOODS AVE | 8 |
| BYRON BLVD | 8 |
| Other | 99 |
2004 - 2015 National Fire Incident Reporting System (NFIRS) incidents
- Incident types reported to NFIRS in Warwick, RI
- 10,73961.9%Rescue & EMS
- 2,01211.6%Hazardous Condition
- 1,3007.5%False Alarm
- 1,2006.9%Service Call
- 1,0616.1%Fire
- 1,0065.8%Good Intent Call
- Fire incident types reported to NFIRS in Warwick, RI
- 48345.5%Outside Fires
- 29127.4%Structure Fires
- 19818.7%Mobile Property/Vehicle Fires
- 898.4%Other
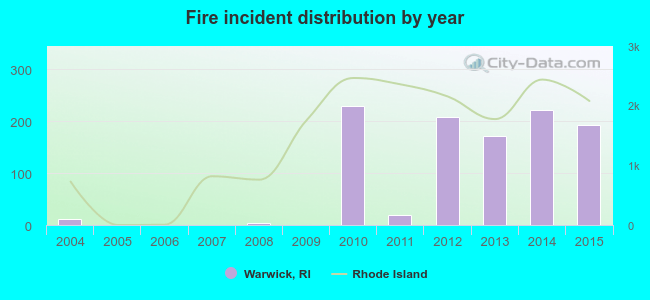 According to the data from the years 2004 - 2015 the average number of fire incidents per year is 88. The highest number of fire incidents - 230 took place in 2010, and the least - 0 in 2005. The data has a growing trend.
The average number of yearly fire incidents per 10k residents in Warwick, RI compared to nearest cities:
(Note: Based on data for the last 3 years, including only cities with population 5,000 and above)
| Warwick: | 0.3 |
| Cranston: | 25.6 |
| Barrington: | 5.4 |
| West Warwick: | 79.6 |
| East Greenwich: | 23.6 |
| East Providence: | 21.7 |
| Providence: | 4.8 |
| Bristol: | 54.8 |
| Johnston: | 26.6 |
 The median response time based on all reported fire incidents is 4 minutes. This is lower than the Rhode Island median value.
The median response time in Warwick, RI compared to nearest cities:
(Note: Based on data for all years, including only cities with at least 500 fire incidents)
| Warwick: | 4 minutes |
| Cranston: | 4 minutes |
| West Warwick: | 3 minutes |
| East Providence: | 5 minutes |
| Providence: | 5 minutes |
| Bristol: | 6 minutes |
| Coventry: | 7 minutes |
| Seekonk: | 6 minutes |
| North Providence: | 4 minutes |
 30.3% incidents where reported in the morning and 69.7% in the evening. The most fires (15.7%) took place on Saturday, and the least (12.5%) on Friday.
 Based on the 1,061 fire incident reports from years 2004 - 2015 most fires (13.2%) took place during May, and the least (2.6%) in December.
 Out of all 17,336 cases reported during the years 2004 - 2015, the most belonged to the categories: Rescue & EMS (61.9%), Hazardous Condition (11.6%), and False Alarm (7.5%).
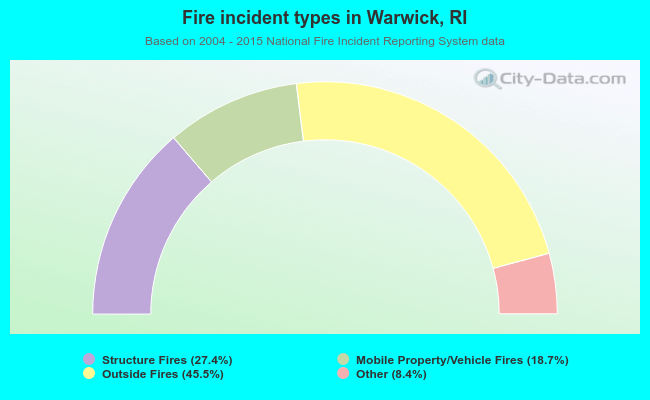 When looking into fire subcategories, the most incidents belonged to: Outside Fires (45.5%), and Structure Fires (27.4%).