East Greenwich: Fire Incidents, Rhode Island (RI)
Where are fire incidents reported in East Greenwich, RI
Something went wrong! Please refresh the page.
|
| |||||||||||||||||||||||||||||||||||||||||||||||||||||||||||||||||||||||||||||||||||||||||||||||||||||||||||||
2007 - 2018 National Fire Incident Reporting System (NFIRS) incidents
- Incident types reported to NFIRS in East Greenwich, RI
- 5,81953.3%Rescue & EMS
- 1,80616.5%Service Call
- 1,25911.5%Hazardous Condition
- 1,14110.4%False Alarm
- 5014.6%Good Intent Call
- 3553.3%Fire
- 300.3%Special Incident
- Fire incident types reported to NFIRS in East Greenwich, RI
- 13437.7%Outside Fires
- 10228.7%Structure Fires
- 6718.9%Mobile Property/Vehicle Fires
- 5214.6%Other
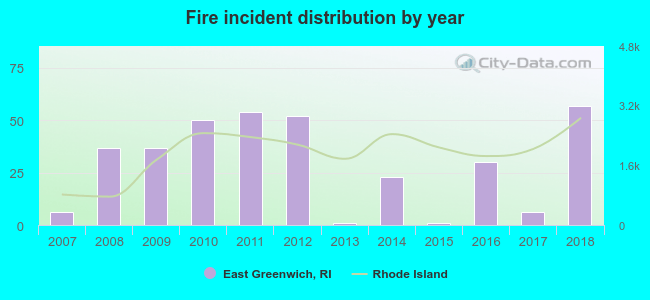 Based on the data from the years 2007 - 2018 the average number of fire incidents per year is 30. The highest number of fires - 57 took place in 2018, and the least - 1 in 2013. The data has a rising trend.
The average number of yearly fire incidents per 10k residents in East Greenwich, RI compared to nearest cities:
(Note: Based on data for the last 3 years, including only cities with population 5,000 and above)
| East Greenwich: | 23.6 |
| West Warwick: | 79.6 |
| North Kingstown: | 5.3 |
| Warwick: | 0.3 |
| Coventry: | 21.0 |
| Exeter: | 64.9 |
| Cranston: | 25.6 |
| West Greenwich: | 62.5 |
| Jamestown: | 16.7 |

 32.7% incidents where reported in the morning and 67.3% in the evening. The most fires (20.8%) took place on Saturday, and the least (10.1%) on Monday.
 Based on the 355 fire incident reports from years 2007 - 2018 most fires (12.1%) took place during April, and the least (5.9%) in February.
 Out of all 10,922 cases reported during the years 2007 - 2018, the most belonged to the categories: Rescue & EMS (53.3%), Service Call (16.5%), and Hazardous Condition (11.5%).
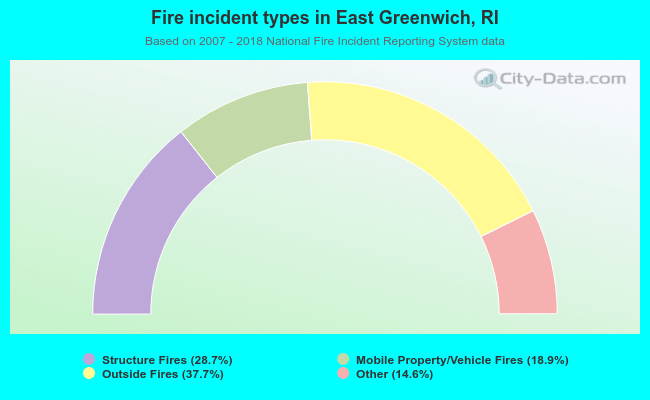 When looking into fire subcategories, the most reports belonged to: Outside Fires (37.7%), and Structure Fires (28.7%).