Cranston: Fire Incidents, Rhode Island (RI)
Where are fire incidents reported in Cranston, RI
Something went wrong! Please refresh the page.
| Fire incidents reported | |
|---|---|
| Sreet name | Count |
| PLAINFIELD PIKE | 132 |
| CRANSTON ST | 96 |
| BROAD ST | 76 |
| OAKLAWN AV | 66 |
| HILLSIDE RD | 64 |
| PARK AV | 62 |
| PONTIAC AV | 62 |
| PONTIAC AVE | 56 |
| DYER AV | 52 |
| RESERVOIR AV | 48 |
| SOCKANOSETT CROSS RD | 48 |
| OAKLAWN AVE | 46 |
| PARK AVE | 46 |
| GARFIELD AV | 44 |
| I 295 | 44 |
| DYER AVE | 42 |
| RESERVOIR AVE | 38 |
| CHAPEL VIEW BLVD | 36 |
| NEW LONDON AV | 36 |
| ATWOOD AV | 34 |
| ATWOOD AVE | 34 |
| PLAINFIELD PKE | 34 |
| HOPE RD | 30 |
| I 95 | 28 |
| NEW LONDON AVE | 28 |
| PIPPIN ORCHARD RD | 28 |
| GARFIELD AVE | 26 |
| LATEN KNIGHT RD | 26 |
| PHENIX AV | 26 |
| ELMWOOD AV | 24 |
| Other | 462 |
2010 - 2018 National Fire Incident Reporting System (NFIRS) incidents
- Incident types reported to NFIRS in Cranston, RI
- 42,85969.8%Rescue & EMS
- 5,4178.8%False Alarm
- 4,6887.6%Hazardous Condition
- 3,3925.5%Service Call
- 2,8754.7%Good Intent Call
- 1,8743.1%Fire
- 2000.3%Special Incident
- 730.1%Overpressure Rupture
- Fire incident types reported to NFIRS in Cranston, RI
- 82343.9%Outside Fires
- 58631.3%Structure Fires
- 30016.0%Mobile Property/Vehicle Fires
- 1658.8%Other
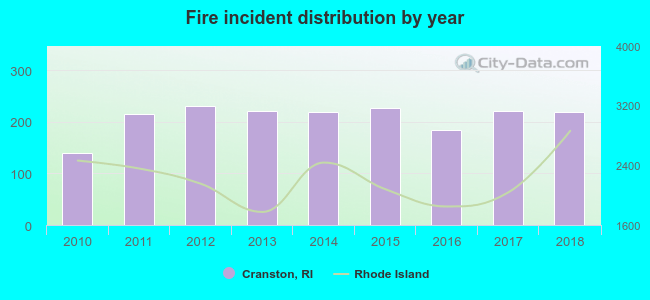 Based on the data from the years 2010 - 2018 the average number of fire incidents per year is 208. The highest number of fires - 231 took place in 2012, and the least - 140 in 2010. The data has a rising trend.
The average number of yearly fire incidents per 10k residents in Cranston, RI compared to nearest cities:
(Note: Based on data for the last 3 years, including only cities with population 5,000 and above)
| Cranston: | 25.6 |
| Providence: | 4.8 |
| Johnston: | 26.6 |
| Warwick: | 0.3 |
| East Providence: | 21.7 |
| West Warwick: | 79.6 |
| Barrington: | 5.4 |
| Pawtucket: | 0.3 |
| Scituate: | 3.9 |
 The median response time based on all reported fire incidents is 4 minutes. This is lower compared to the state median value.
The median response time in Cranston, RI compared to nearest cities:
(Note: Based on data for all years, including only cities with at least 500 fire incidents)
| Cranston: | 4 minutes |
| Providence: | 5 minutes |
| Warwick: | 4 minutes |
| East Providence: | 5 minutes |
| West Warwick: | 3 minutes |
| North Providence: | 4 minutes |
| Seekonk: | 6 minutes |
| Central Falls: | 2 minutes |
| Smithfield: | 6 minutes |
 According to the reports from the years 2010 - 2018 the average number of fire-related yearly deaths is 0. The highest number of deaths - 1 took place in 2011, and the lowest - 0 in 2010. The data has a constant trend.
 According to the data from the years 2010 - 2018 the average number of fire-related casualties per year is 3. The highest number of reported casualties - 7 took place in 2011, and the lowest - 0 in 2018. The data has a declining trend.
The average number of casualties per 1,000 fires is 17. This indicator was the highest - 36 in 2010, and the lowest 0 in 2018. The trend for casualties per 1,000 fire incidents is dropping. Compared to the state value the number of injuries per 1,000 incidents is higher.
According to the data from the years 2010 - 2018 the average number of fire-related casualties per year is 3. The highest number of reported casualties - 7 took place in 2011, and the lowest - 0 in 2018. The data has a declining trend.
The average number of casualties per 1,000 fires is 17. This indicator was the highest - 36 in 2010, and the lowest 0 in 2018. The trend for casualties per 1,000 fire incidents is dropping. Compared to the state value the number of injuries per 1,000 incidents is higher.Casualties per 1,000 incidents in Cranston, RI compared to nearest cities:
(Note: Based on data for all years, including only cities with at least 500 fire incidents)
| Cranston: | 16.0 |
| Providence: | 0.7 |
| Warwick: | 2.8 |
| East Providence: | 44.7 |
| West Warwick: | 10.0 |
| North Providence: | 10.6 |
| Seekonk: | 11.2 |
| Central Falls: | 11.8 |
| Smithfield: | 6.1 |
 28.5% incidents where reported in the morning and 71.5% in the evening. The most fires (15.5%) took place on Saturday, and the least (11.9%) on Tuesday.
 According to the 1,874 fire incident reports from years 2010 - 2018 most fires (11.5%) took place during July, and the least (5.2%) in February.
 Out of all 61,421 cases reported during the years 2010 - 2018, the most belonged to the categories: Rescue & EMS (69.8%), False Alarm (8.8%), and Hazardous Condition (7.6%).
 When looking into fire subcategories, the most incidents belonged to: Outside Fires (43.9%), and Structure Fires (31.3%).