Central Falls: Fire Incidents, Rhode Island (RI)
Where are fire incidents reported in Central Falls, RI
Something went wrong! Please refresh the page.
| Fire incidents reported | |
|---|---|
| Sreet name | Count |
| BROAD ST | 246 |
| DEXTER ST | 230 |
| WASHINGTON ST | 226 |
| HUNT ST | 136 |
| SUMMER ST | 126 |
| RAND ST | 110 |
| LONSDALE AVE | 108 |
| CENTRAL ST | 104 |
| HIGH ST | 104 |
| SYLVIAN ST | 84 |
| CLAY ST | 82 |
| CROSS ST | 82 |
| GARFIELD ST | 80 |
| COWDEN ST | 78 |
| FLETCHER ST | 62 |
| FALES ST | 56 |
| PINE ST | 56 |
| ILLINOIS ST | 54 |
| SUMNER AVE | 52 |
| HEDLEY AVE | 46 |
| LEDGE ST | 44 |
| FOUNDRY ST | 40 |
| CLEVELAND ST | 38 |
| VALLEY ST | 38 |
| CHESTNUT ST | 36 |
| DARLING ST | 34 |
| LINCOLN AVE | 34 |
| SUMMIT ST | 32 |
| FULLER AVE | 30 |
| PARKER ST | 30 |
2003 - 2018 National Fire Incident Reporting System (NFIRS) incidents
- Incident types reported to NFIRS in Central Falls, RI
- 6,97857.2%Rescue & EMS
- 1,76414.5%False Alarm
- 1,61513.2%Fire
- 7115.8%Hazardous Condition
- 6315.2%Good Intent Call
- 4663.8%Service Call
- 200.2%Overpressure Rupture
- Fire incident types reported to NFIRS in Central Falls, RI
- 1,41587.6%Structure Fires
- 1076.6%Outside Fires
- 613.8%Mobile Property/Vehicle Fires
- 322.0%Other
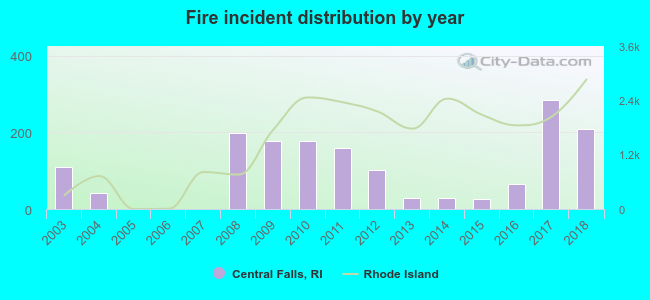 Based on the data from the years 2003 - 2018 the average number of fire incidents per year is 101. The highest number of fires - 284 took place in 2017, and the least - 0 in 2005. The data has a rising trend.
The average number of yearly fire incidents per 10k residents in Central Falls, RI compared to nearest cities:
(Note: Based on data for the last 3 years, including only cities with population 5,000 and above)
| Central Falls: | 96.2 |
| Pawtucket: | 0.3 |
| Lincoln: | 31.0 |
| Cumberland: | 39.7 |
| Providence: | 4.8 |
| East Providence: | 21.7 |
| Johnston: | 26.6 |
| Smithfield: | 27.7 |
| Cranston: | 25.6 |
 The median response time based on all reported fire incidents is 2 minutes. This is much lower compared to the state median value.
The median response time in Central Falls, RI compared to nearest cities:
(Note: Based on data for all years, including only cities with at least 500 fire incidents)
| Central Falls: | 2 minutes |
| Lincoln: | 4 minutes |
| North Providence: | 4 minutes |
| Cumberland: | 6 minutes |
| Seekonk: | 6 minutes |
| Attleboro: | 4 minutes |
| Providence: | 5 minutes |
| East Providence: | 5 minutes |
| Smithfield: | 6 minutes |
 According to the reports from the years 2003 - 2018 the average number of fire-related yearly casualties is 1. The highest number of injuries - 6 took place in 2011, and the lowest - 0 in 2005. The data has a dropping trend.
The average number of injuries per 1,000 fire incidents is 9. This indicator was the highest - 38 in 2011, and the lowest 0 in 2005. The trend for injuries per 1,000 incidents is declining. Compared to the state value the number of injuries per 1,000 incidents is about the same.
According to the reports from the years 2003 - 2018 the average number of fire-related yearly casualties is 1. The highest number of injuries - 6 took place in 2011, and the lowest - 0 in 2005. The data has a dropping trend.
The average number of injuries per 1,000 fire incidents is 9. This indicator was the highest - 38 in 2011, and the lowest 0 in 2005. The trend for injuries per 1,000 incidents is declining. Compared to the state value the number of injuries per 1,000 incidents is about the same.Casualties per 1,000 incidents in Central Falls, RI compared to nearest cities:
(Note: Based on data for all years, including only cities with at least 500 fire incidents)
| Central Falls: | 11.8 |
| Lincoln: | 6.0 |
| North Providence: | 10.6 |
| Cumberland: | 7.6 |
| Seekonk: | 11.2 |
| Attleboro: | 9.0 |
| Providence: | 0.7 |
| East Providence: | 44.7 |
| Smithfield: | 6.1 |
 27.6% incidents where reported in the morning and 72.4% in the evening. The most fires (16.4%) took place on Monday, and the least (12.4%) on Saturday.
 According to the 1,615 incident reports from years 2003 - 2018 most fires (11.3%) took place during November, and the least (5.7%) in July.
 Out of all 12,198 cases reported during the years 2003 - 2018, the most belonged to the categories: Rescue & EMS (57.2%), False Alarm (14.5%), and Fire (13.2%).
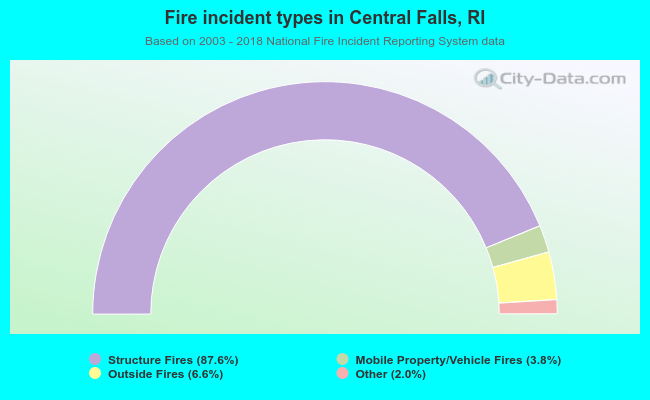 When looking into fire subcategories, the most incidents belonged to: Structure Fires (87.6%), and Outside Fires (6.6%).