Barrington: Fire Incidents, Rhode Island (RI)
Where are fire incidents reported in Barrington, RI
Something went wrong! Please refresh the page.
|
| |||||||||||||||||||||||||||||||||||||||||||||||||||||||||||||||||||||||||||||||||||||||||||||||||||||||||||||
2007 - 2018 National Fire Incident Reporting System (NFIRS) incidents
- Incident types reported to NFIRS in Barrington, RI
- 3,27058.9%Rescue & EMS
- 72613.1%Hazardous Condition
- 55810.0%False Alarm
- 3766.8%Service Call
- 3476.2%Fire
- 2033.7%Good Intent Call
- 561.0%Severe Weather
- 100.2%Special Incident
- 80.1%Overpressure Rupture
- Fire incident types reported to NFIRS in Barrington, RI
- 17751.0%Structure Fires
- 9427.1%Outside Fires
- 5315.3%Other
- 236.6%Mobile Property/Vehicle Fires
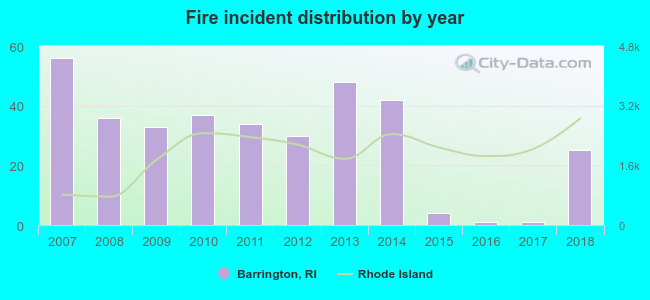 Based on the data from the years 2007 - 2018 the average number of fire incidents per year is 29. The highest number of reported fires - 56 took place in 2007, and the least - 1 in 2016. The data has a declining trend.
The average number of yearly fire incidents per 10k residents in Barrington, RI compared to nearest cities:
(Note: Based on data for the last 3 years, including only cities with population 5,000 and above)
| Barrington: | 5.4 |
| East Providence: | 21.7 |
| Bristol: | 54.8 |
| Warwick: | 0.3 |
| Cranston: | 25.6 |
| Providence: | 4.8 |
| Tiverton: | 43.7 |
| Pawtucket: | 0.3 |
| Portsmouth: | 14.0 |

 According to the data from the years 2007 - 2018 the average number of fire-related casualties per year is 0. The highest number of injuries - 1 took place in 2007, and the lowest - 0 in 2008. The data has a dropping trend.
 28.0% incidents where reported in the morning and 72.0% in the evening. The most fires (16.4%) took place on Sunday, and the least (10.4%) on Thursday.
 Based on the 347 incident reports from years 2007 - 2018 most fires (11.0%) took place during January, and the least (4.9%) in August.
 Out of all 5,554 cases reported during the years 2007 - 2018, the most belonged to the categories: Rescue & EMS (58.9%), Hazardous Condition (13.1%), and False Alarm (10.0%).
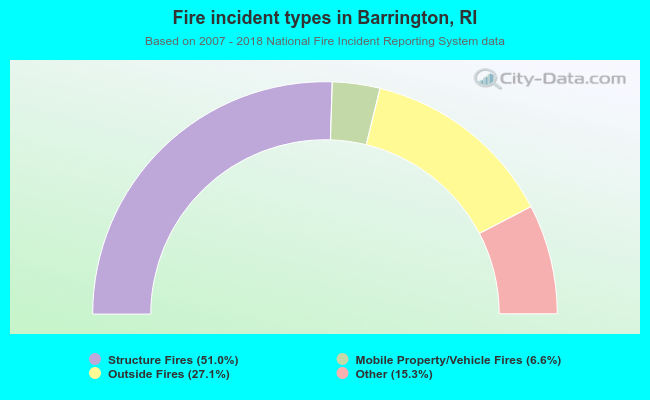 When looking into fire subcategories, the most incidents belonged to: Structure Fires (51.0%), and Outside Fires (27.1%).